U.S. Auto Sales Stumbled in First Quarter Major auto makers posted declines in U.S. sales for the first quarter, adding pressure on car companies already grappling with weaker conditions in important markets globally.
But March was a relief!

(…) Despite the first-quarter decline, strong pricing in the U.S. remains a silver lining for the auto industry. Consumers continue to shell out more money for new vehicles, largely because of a rapid rotation from traditional sedans into larger, pricier vehicles like SUVs and pickup trucks, helping to bolster auto makers’ bottom lines.
Detroit’s auto makers have been rolling out more SUVs and pickup trucks to capitalize on the trend. For example, GM said buyers of its redesigned Chevrolet Silverado and GMC Sierra pickup trucks shelled out $8,000 more for the new trucks last quarter—to around $48,000—compared with what they spent on the older versions a year earlier.
Industrywide, the average price paid by an individual buyer rose about 3% in the first quarter to $33,319, a record for the period, according to research firm J.D. Power.
U.S. Durable-Goods Orders Fell 1.6% in February Better-than-expected data likely to further ease economists’ worries about slowdown in growth
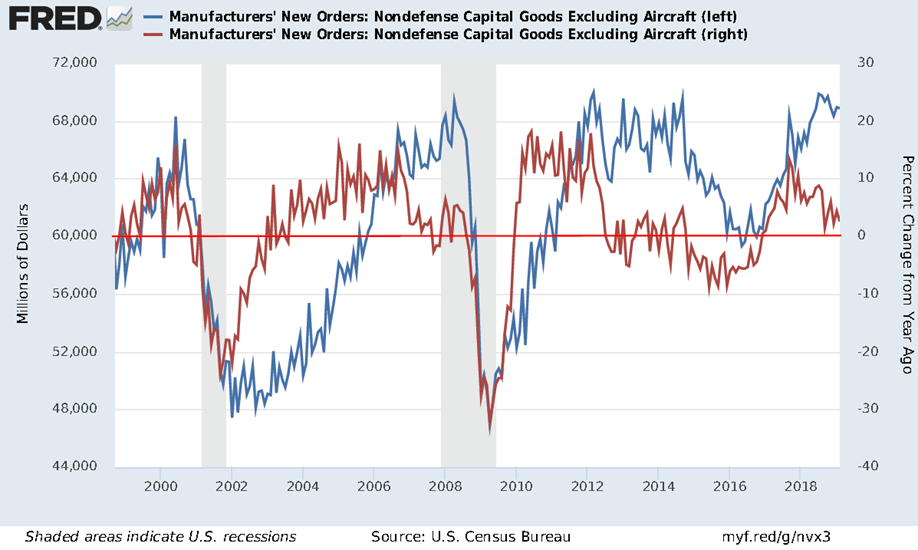
(…) Nondefense aircraft orders plunged a seasonally adjusted 31% in February. (…) A closely watched proxy for business investment, new orders for nondefense capital goods excluding aircraft, declined 0.1% in February after rising a revised 0.9% in January, according to Tuesday’s data.
The business investment measure was up 2.6% in the first two months of this year compared with the same period in 2018.
Tuesday’s report showed orders for motor vehicles falling 0.1% in February from January. Excluding transportation, orders were up 0.1%. (…)
Non-def cap goods orders are unchanged during the last 3 months and down 1.4% from their July 2018 peak.
Heavy-Duty Truck Orders Hit the Brakes in March Orders for Class 8 rigs fell to the lowest level since October 2016 after a strong surge in buying in 2018
North American freight carriers ordered 15,700 Class 8 trucks, the big rigs used for regional and long-haul routes, according to a preliminary report from ACT Research. That is a 66% drop compared with March 2018, and the lowest level since October 2016, when tepid shipping demand meant many transportation companies held back on upgrading or expanding their fleets.
The slide in March, in which orders also declined 6.7% from February, follows a long surge in fleet expansion in 2018, when trucking companies riding one of the strongest freight markets in years rushed to order new trucks, outpacing manufacturers’ production capacity. (…)
March is the fourth straight month in which new orders were significantly lower than the rate of new vehicle production, according to ACT. (…) truck makers still have a backlog of 397,000 orders built up over the past 12 months after one of the busiest order periods in nearly 15 years. (…)
Solid upturn in U.S. services activity, but business expectations drop to lowest since December 2017
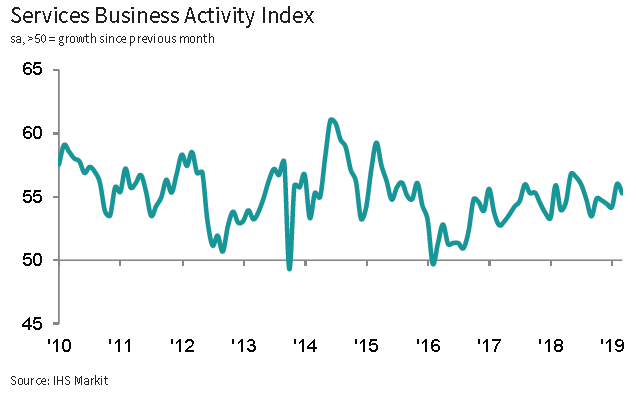
March data signalled a further strong expansion in business activity across the U.S service sector. The rise was slightly softer than that seen in February, but was nonetheless supported by a solid increase in new orders and a further upturn in new business from abroad. On the prices front, inflationary pressures eased in March. The rate of increase in charges was the slowest since October 2017 and input cost inflation posted below the series trend. Despite strong output growth and client demand, business confidence dipped to the lowest level since December 2017.
The seasonally adjusted final IHS Markit U.S. Services Business Activity Index registered 55.3 in March, down slightly from 56.0 in February. The rate of expansion was broadly in line with the series average and rounded off a strong start to 2019. The first quarterly average signalled the fastest service sector output growth since the second quarter of 2018. Moreover, March data indicated the second-quickest upturn in business activity since July 2018, with firms linking this to robust client demand.
New business received by service sector firms also expanded at a softer, albeit strong rate in March. The rise in new orders was attributed to greater demand from new and existing clients. Although the pace of growth was slightly below the series trend, it was one of the strongest seen over the last five months.
Meanwhile, new export business increased for the second month running, often linked to the acquisition of new clients. Nevertheless, service providers expressed a lower degree of confidence towards the outlook for output over the coming 12 months in March. Although service sector firms were buoyed by hopes of further new business growth, they highlighted concerns surrounding uncertainty regarding global trade tensions, economic growth worries and more intense competition. The level of optimism dropped to the lowest since December 2017 and was muted overall.
Inflationary pressures continued to soften in March. Rates of both input price and output charge inflation eased, with service sector cost burdens rising at a relatively modest pace. Firms stated that labour and raw material costs had increased further, but to a less marked extent. The rate of output charge inflation was broadly in line with the series trend despite easing to the slowest since October 2017.
Panellists suggested that higher output prices were linked to the pass-through of greater input costs to clients. In line with a strong upturn in new business, service providers noted a third successive rise in outstanding business. The rate of backlog accumulation was the joint-fastest since November 2014 and solid overall. That said, pressure on capacity was not reflected in employment growth, where the rate of job creation slowed to the weakest since May 2017, linked in part to lower business confidence.
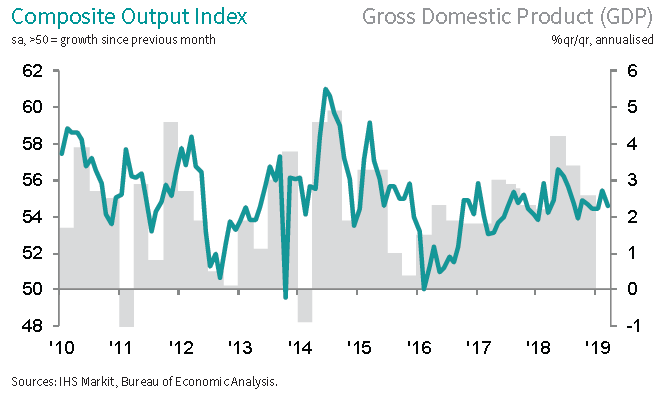
The Composite PMI Output Index registered 54.6 in March, down from 55.5 in February. The overall increase was driven by the service sector, with manufacturing firms registering only a marginal rise in output. Similarly, a strong upturn in new business across the service sector supported a solid private sector expansion.
Manufacturing firms noted a moderate rise in new orders, but the rate of growth was the slowest since June 2017 amid reports of softer underlying demand. New export orders remained in expansionary territory in March, with both manufacturing and service sector firms signalling an increase in foreign demand.
Inflationary pressures eased further in March, with input price inflation dipping to a two-year low. In response, panellists noted a solid, but softer rise in output charges. The rate of output price inflation was just above the series average but less marked than the trend for 2018. Capacity pressures remained evident in March, with private sector employment and backlogs increasing at a modest pace. Manufacturers continued to signal a solid rise in workforce numbers, but service providers indicated the slowest rate of job creation since May 2017.
Private sector business confidence took a tumble in March, with the degree of optimism dipping to the lowest since September 2016.
For the first quarter as a whole, the surveys are consistent with the economy growing at an annualized rate of approximately 2.5%, painting a relatively rosy picture compared to official data, which so far suggest GDP could come in slightly weaker.
Dig deeper and the picture darkens. Inflows of new work have moderated markedly compared to this time last year as manufacturing weakness and growing concerns about the economic outlook have increasingly spread to the service sector. Business optimism about the year ahead is now the lowest for two and a half years, posing downside risks to growth in coming months.
Hiring has already been hit by the drop in business optimism and weakened inflows of new work, easing to the lowest since mid-2017, albeit still indicating non-farm payroll growth of around 165,000. (…)
Manufacturing downturn weighs on euro area growth in March
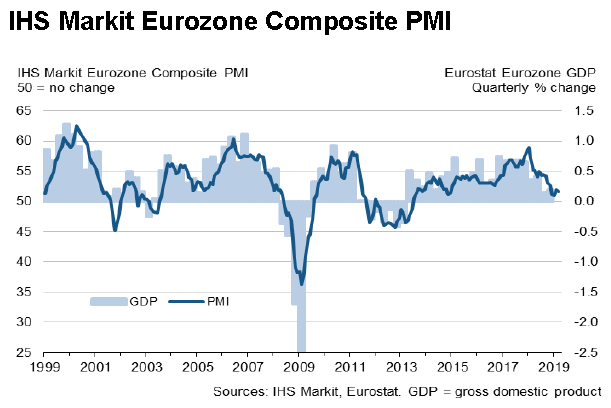
The IHS Markit Eurozone PMI® Composite Output Index continued to signal modest growth of the euro area’s private sector economy in March. After accounting for seasonal factors, the index recorded 51.6, down slightly from 51.9 in the previous month but a little firmer than the earlier flash reading of 51.3.
March’s headline PMI Output index belied notably divergent trends in activity across the region’s manufacturing and service sectors. Whereas services activity rose in March at the strongest rate since last November, goods producers recorded the greatest monthly fall in output since April 2013.
The weakness in manufacturing production was closely linked to deteriorating demand conditions, both at home and abroad. New work placed at manufacturing firms fell at the greatest rate since late-2012, which broadly offset solid growth in services. Overall private sector new work was subsequently only slightly higher than in February.
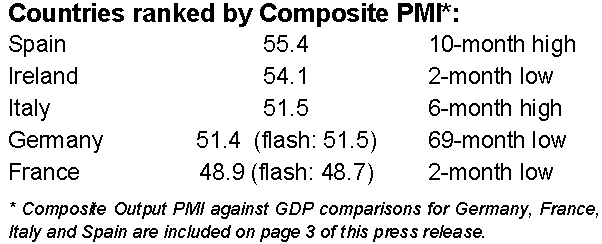
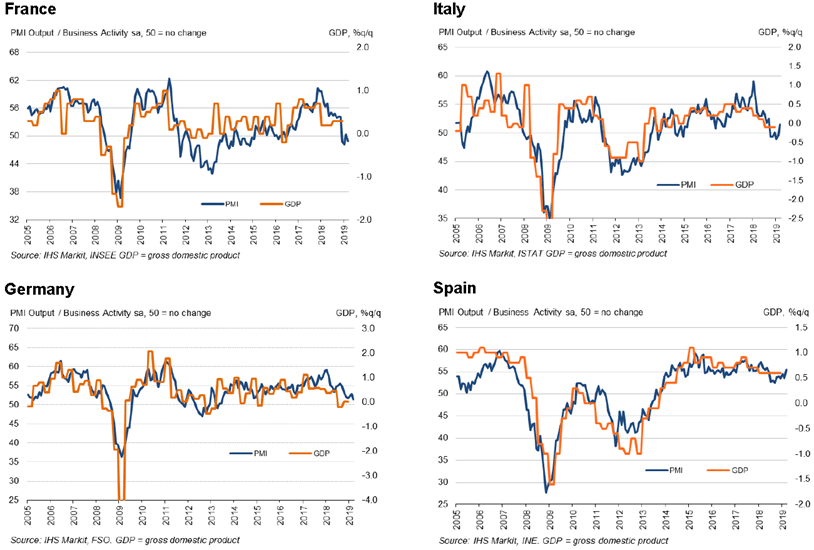
The downturn in manufacturing weighed particularly on the German economy. Latest PMI data showed that Germany expanded at its weakest rate for nearly six years during March. However, it was France that was the weakest performing country, with the nation returning to modest contraction following slight growth in February. (…)
Meanwhile, private sector employment in the euro area continued to increase at a solid rate during March. Growth has now been registered continuously for nearly four-and-a-half years, although the latest net gains were predominantly led by the service sector as manufacturing job were little-changed since February. Additional labour capacity helped firms to keep on top of workloads. March’s survey data showed that backlogs of work fell for the third time in the past four months.
Input cost pressures continued to weaken in March. Although still rising at a marked pace, the degree to which operating expenses increased was the slowest recorded by the survey since October 2016. In contrast, output charges rose at a slightly faster pace than in February. (…)
March’s IHS Markit Eurozone PMI® Services Business Activity Index rose further above the 50.0 no-change mark, reaching a level of 53.3, from 52.8 in February. The latest reading was the best recorded since last November.
Growth was led by Germany and Spain, where rates of growth strengthened since February. Ireland also saw a marked rise in activity, whilst solid growth was recorded in Italy. France returned to marginal contraction.
Supporting the upturn in overall activity was a rise in new business volumes, which grew to the strongest degree in four months. The more positive demand environment encouraged firms to again take on additional staff at a solid rate. Germany, Ireland and Spain all recorded notable gains in employment since the previous month.
Wage pressures remained a key source of rising overall operating costs during March. That said, the degree to which input prices increased was the lowest recorded by the survey in just under a year. By contrast, output charges were raised at the fastest rate since January 2018.
With activity and new work increasing at stronger rates in March, service providers were a little more confident about the future. According to latest data, business sentiment improved over the month to its highest level since last September.
Chris Williamson, Chief Business Economist at IHS Markit:
(…) The service sector has managed to sustain a relatively resilient rate of growth but has also lost momentum in recent months. This should come as no surprise as history tells us that robust service sector growth usually depends on a healthy manufacturing economy.
At current levels, the PMI remains consistent with GDP rising by 0.2% in the first quarter, but unless manufacturing pulls out of its downturn the overall pace of economic growth will likely weaken in the second quarter as the malaise spreads to the service sector. In this respect, with forward-looking indicators from the manufacturing sector suggesting goods production will fall further in the coming months, downside risk to the outlook have intensified.
Chinese business activity rises at quickest pace for nine months
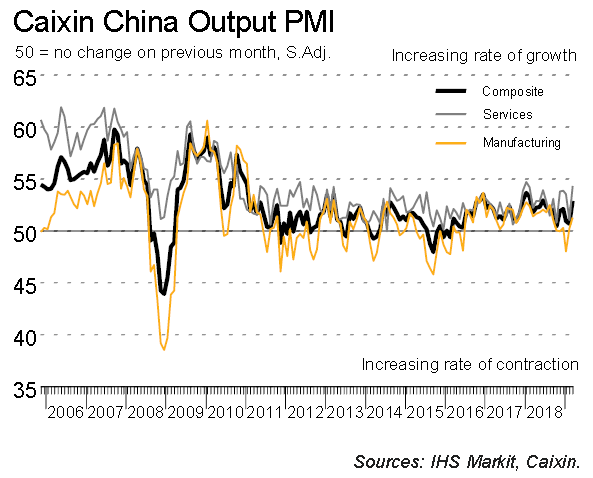
The Caixin China Composite PMI™ data (which covers both manufacturing and services) pointed to a solid increase in business activity across China at the end of the first quarter. At 52.9, the Composite Output Index was up from 50.7 in February to signal the strongest increase in activity since June 2018.
The higher composite headline index reading was supported by improved performances across both the manufacturing and service sectors. Furthermore, the service sector registered a solid expansion of business activity during March, with a number of firms linking the rise to stronger underlying market conditions. This was highlighted by the seasonally adjusted Chinese Services Business Activity Index rising from 51.1 in February to 54.4, to mark the quickest increase in activity levels since January 2018. Goods producers also saw a faster increase in production at the end of the opening quarter. Though modest, the rate of growth was the most marked since August 2018.
Improved trends were also seen for new orders in both monitored sectors during March. Services companies registered a solid and accelerated rise in new work that was the quickest recorded for 14 months. At the same time, manufacturing companies signalled a slightly faster, albeit still marginal, increase in new business. At the composite level, total new work expanded at a moderate pace that was the quickest seen since February 2018.
Chinese companies also saw an upturn in foreign client demand at the end of the first quarter. In the service sector, new export sales rose at the second-strongest rate since December 2017 amid reports of greater activity in international markets. Meanwhile, manufacturing firms signalled a fractional increase in new export orders, following a decline in February. Overall, new business from abroad rose slightly in March, offsetting a marginal reduction in the previous month.
March survey data indicated the first increase in composite employment across China for just over a year, though the rate of job creation was only slight. Services providers registered a fractional increase in staffing levels, with the rate of growth similar to that seen in February. At manufacturing companies, workforce numbers increased for the first time in over five years (albeit at a marginal pace).
Divergent trends were seen for outstanding workloads, with manufacturers noting a further modest increase, while services companies registered a fall. Some service providers cited greater efforts to clear backlogs of work. That said, the rate of depletion eased from February and was only marginal. As a result, the level of work-in-hand (but not yet completed) at the composite level was broadly unchanged from the previous month.
Average input prices faced by Chinese firms continued to rise modestly at the end of the first quarter. The rate of cost inflation in the service sector eased slightly since February and was moderate overall. Manufacturers meanwhile registered the first increase in purchasing costs for four months in March, though the rate of growth was only marginal.
Companies in China continued to increase their average selling prices during March, with a number of firms linking the rise to the pass-through of higher input costs to customers and signs of firmer client demand. Though modest, factory gate prices increased at the quickest rate for five months. Meanwhile, services companies raised their prices at a marginal pace that was similar to that seen in February.
Reflective of improvements in overall demand conditions, business confidence picked up slightly across both the manufacturing and service sectors during March. Services companies registered the highest level of optimism for three months, while sentiment reached a ten-month high at manufacturers. That said, expectations remained weaker than their respective long-run trends in both cases.
China-U.S. Trade Talks Enter Crunch Period as Liu Arrives in DC China’s Vice Premier Liu He will resume negotiations with his U.S. counterparts.
(…) China touted “new progress” after last week’s talks and both sides have been working line-by-line through the text of an agreement that can be put before Trump and Xi, according to people familiar with the matter. China has already announced various concessions and pledged to open up industries in steps. (…)
Both countries have yet to agree on what happens to existing U.S. duties on Chinese goods and the terms of an enforcement mechanism to ensure China keeps to the trade deal, the Financial Times reported, citing people briefed on the talks. Other than that, U.S. and China officials have resolved most of the issues surrounding the deal, the FT reported. (…)
The FT also says that absent a breakthrough this week, “China and the US could decide to extend the negotiations, possibly all the way until the G20 summit in Japan at the end of June.”
Investors Brace for Hit to Profits as Costs Rise Investors are concerned that rising wages and energy costs will eat into corporate profits, threatening the decadelong bull market in stocks.
Economists expect to see a strong month of wage growth when the Labor Department releases the March jobs report Friday. Wages grew at their fastest pace in nearly a decade in February, after starting to pick up speed just over a year ago.
At the same time, energy prices have jumped. Fueled by output cuts led by the Organization of the Petroleum Exporting Countries and U.S. sanctions on Venezuela and Iran, U.S. crude-oil futures prices rose 32% in the three months through March, logging their biggest one-quarter percentage gain since 2009. (…)
“All of those factors conspire to say we’re at peak margins,” Mr. Camp said. (…) Net margins for members of the S&P 500 hit 10.7% in the fourth quarter—their highest level on record, according to FactSet data going back to 1999. (…) But some investors now think the only direction margins can go from here is down, as employees benefit more from the long economic expansion.
(…) some investors and strategists remain unflustered. Even with recent gains, wage growth has continued to look sluggish compared with the late stages of previous economic expansions. (…)
Everybody and his uncle have been worrying about profit margins throughout this cycle. The correlation with labor costs is not straightforward:
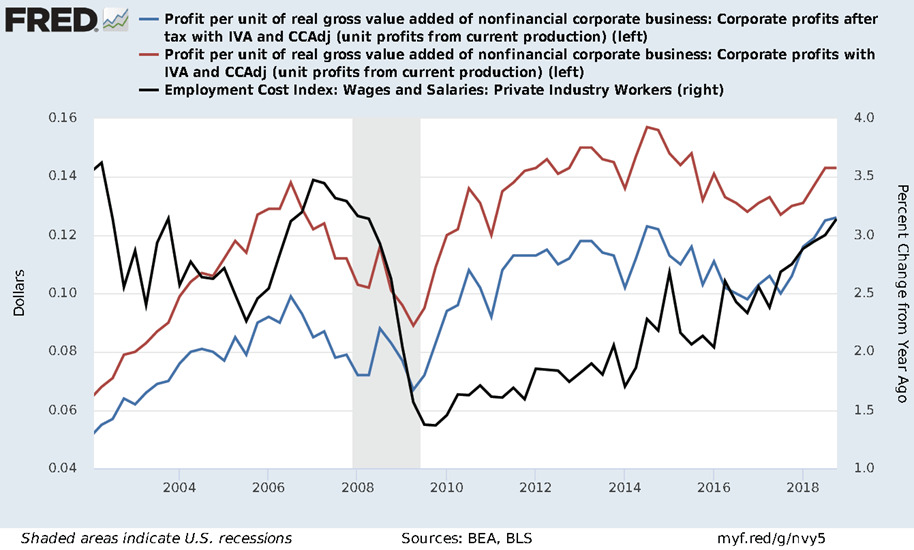
When sales rise faster than labor costs and inflation, margins tend to rise:
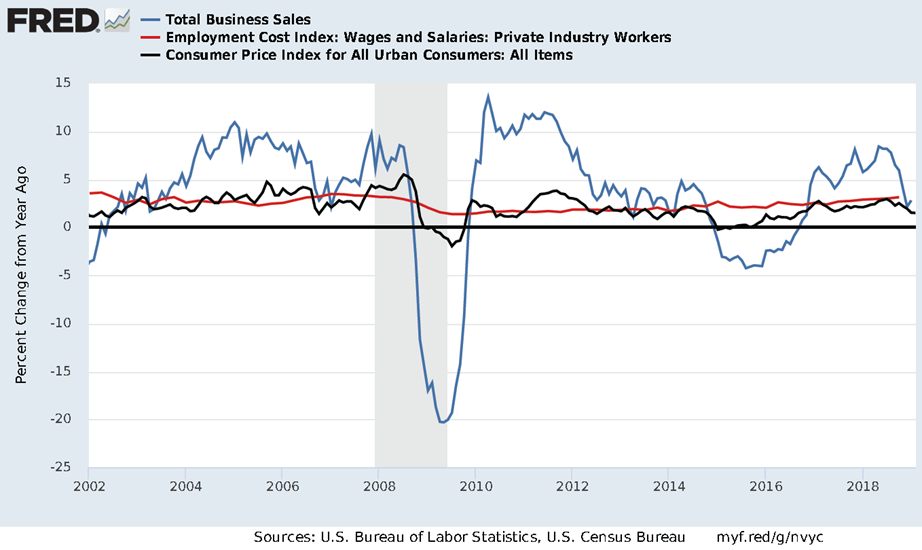
Interestingly, business sales are well correlated with oil prices:

So are profit margins: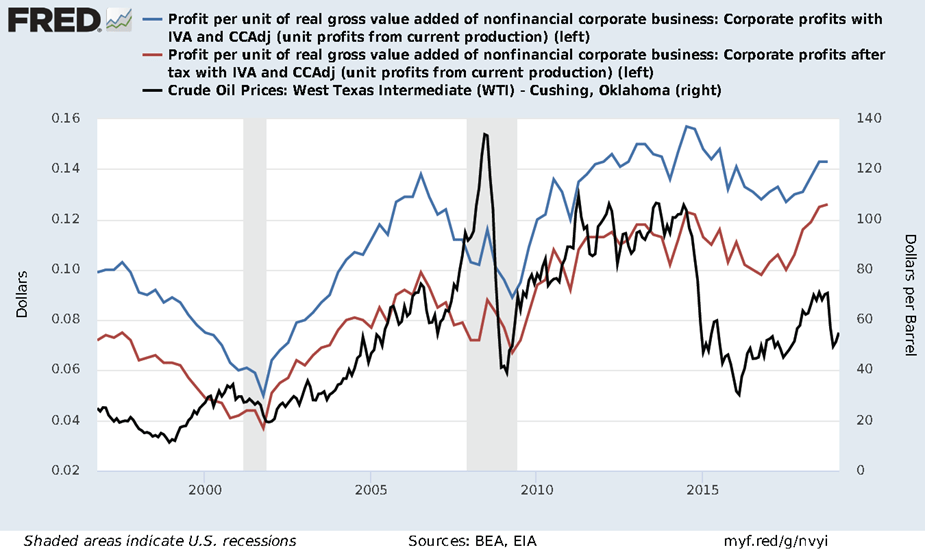
So “all of those factors conspire to say we’re at peak margins” is a rather incomplete statement.
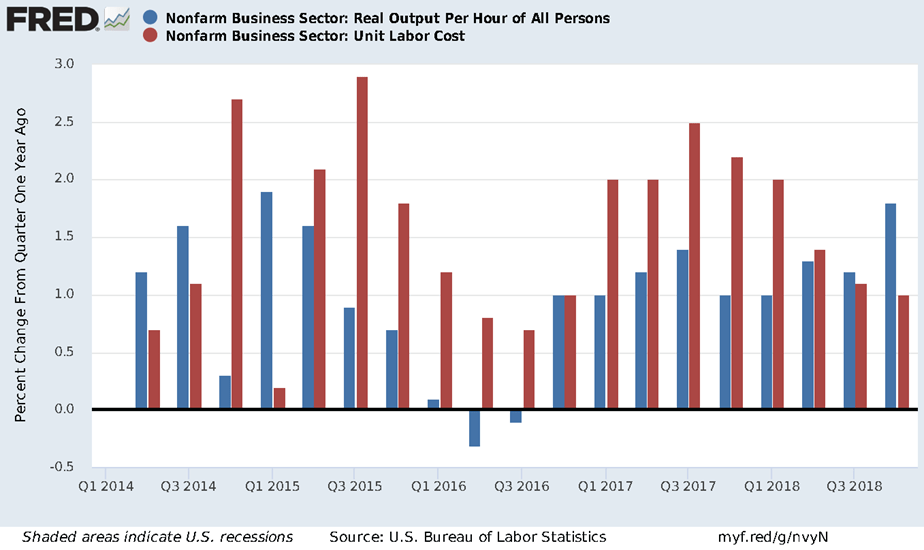
- Rising labor costs could pressurize margins if sales rise more slowly. S&P 500 revenues rose 5.1% in Q4’18 (4.5% ex-Energy) and are forecast to rise in the 5-6% range in 2019. Labor costs have accelerated but are still up less than 3.5%. Productivity appears to be improving keeping unit labor costs in the 1.0-1.5% range:
- Oil prices have been positively correlated with business sales and economy-wide profit margins.
Add that overall inflation being muted, costs pressures are under reasonable control. Worries of a meaningful margin squeeze seem premature. Today’s PMI survey suggests no significant cost pressures at service providers where labor and oil are significant cost items.


 U.S. Factory Activity Accelerated in March


 But the speech carried by Qiushi on Monday included a paragraph that was not in previously published versions, and it has caught the attention of observers.


