The enemy of knowledge is not ignorance, it’s the illusion of knowledge (Stephen Hawking)

It ain’t what you don’t know that gets you into trouble. It’s what you know for sure that just ain’t so (Mark Twain)

Invest with smart knowledge and objective odds

THE DAILY EDGE: 5 FEBRUARY 2019

Fed Survey Shows Tighter Lending Standards, Weakening Credit Demand

(…) “Banks reported expecting to tighten standards for all categories of business loans as well as credit-card loans and jumbo mortgages,” the survey said. “Meanwhile, banks anticipate that loan performance will deteriorate for all surveyed categories.” (…)

The situation changed most with respect to construction and land-development loans. In the fourth quarter, 16% of banks tightened their credit standards for this type of loan, while just 3% eased them. That was up from the third quarter, when 9% tightened while 3 % eased. One-fourth of banks reported weaker demand in the fourth quarter, compared with 4% seeing stronger demand.

Many banks expected those trends to continue into 2019, with around one-fourth of banks expecting an uptick in delinquencies and charge-offs in their construction and land-development as well as commercial and industrial loans.

More banks tightened their standards for commercial real-estate loans and consumer credit-cards in the fourth quarter than loosened them, the survey said.

A growing share of banks also reported weakening demand for various types of residential mortgages and consumer loans in the fourth quarter.

Oft-cited reasons for tightening lending standards included “a less favorable or more uncertain economic outlook,” declining collateral values and lower appetite for risk.

Banks’ lower appetite for risk coincides with Americans’ lower appetite for debt:

  
Dealers Are Loaded With Unsold Cars Analysts warn car makers could be forced to cut factory production with U.S. auto sales expected to weaken in 2019

There were 3.95 million vehicles on dealership lots at the end of January, a 4% increase from December and up nearly 3% from the prior-year January, according to data released Monday by Wards Auto. (…)

General Motors Co. has already moved to end production at five North American factories this year in response to falling sedan sales, and aiming to get ahead of an expected U.S. car market downturn. More auto makers could be forced to follow suit as rising interest rates on new-car loans and more affordable options on the used-car lot are expected to put a damper on new-car sales this year. (…)

U.S. Factory Orders and Shipments Fall

Manufacturers’ orders declined 0.6% (+4.1% y/y) during November following an unrevised 2.1% October fall. The Action Economics Forecast survey looked for a 0.4% rise.

Durable goods orders rebounded 0.7% m/m (5.3% y/y) after a 2.1% decline. Orders for defense and civilian aircraft recovered following sharp October declines. Excluding transportation altogether, new orders for durable goods fell 0.4% (+4.8% y/y). Strength in orders for metals was offset by a decline in machinery.

Orders for nondurable goods (which equal shipments) fell 1.9% (+2.9% y/y) after a 0.1% uptick. A 9.3% decline in shipments from petroleum refineries led the decline (+5.2% y/y). (…)

large image
  • Monthly changes in new orders (ex. transportation): (The Daily Shot)

COMPOSITE PMIs

The Caixin China Composite PMI™ data (which covers both manufacturing and services) signalled higher Chinese business activity for the thirty-fifth month in a row in January. However, the rate of expansion softened since December, as shown by the Composite Output Index posting down from 52.2 at 50.9 in January.

image

On a sector basis, growth continued to be driven by the service sector, which saw activity expand solidly at the start of the year. Notably, the seasonally adjusted Caixin China General Services Business Activity Index was down only slightly from 53.9 in December to 53.6. In contrast, manufacturing companies signalled a relatively subdued trend, with output declining modestly in January.

Total new orders rose slightly in the latest survey period. Sector data signalled divergent trends, with a sustained and strong rise in new business across services companies contrasting with a reduction at manufacturers. Notably, service providers registered the fastest increase in new work for seven months.

January data pointed to an improved trend for exports, as overall new work from abroad increased for the first time in ten months. Encouragingly, both manufacturing and services firms registered higher export sales at the start of 2019. Furthermore, service providers recorded the steepest increase in export orders for over a year.

With activity levels rising solidly, services companies in China continued to add to their workforce numbers in January. Though marginal, the rate of job creation edged up to a three-month high. Manufacturing employment meanwhile remained on a downward trend, though the latest fall in staff numbers was the least marked since last April. At the composite level, payroll numbers stabilised following a seven-month sequence of decline.

The level of outstanding work continued to increase at Chinese firms during January, thereby extending the current trend to just under three years. That said, the rate of accumulation remained marginal. The upturn was largely driven by the manufacturing sector, which saw backlogs rise modestly, as services companies registered a slight decline.

Average input costs continued to rise at the composite level, though the rate of inflation eased to the weakest in three years. While services companies recorded the slowest increase in operating expenses since last May, manufacturing firms reported lower input prices for the second month running. A number of panellists mentioned that reduced raw material prices had helped to ease cost pressures.

Prices charged by Chinese companies meanwhile fell for the second month in a row. Output prices set by services firms rose at a fractional pace that was similar to those seen at the end of last year. In contrast, factory gate prices fell for the third successive month and at a quicker rate. A number of monitored firms mentioned that relatively subdued demand conditions and lower input costs had led them to cut their charges.

Businesses in China were generally optimistic that activity will be higher than current levels in 12 months’ time. Notably, the overall level of positive sentiment improved to a five-month high. Services companies remained slightly more optimistic about the outlook than manufacturers, despite the latter seeing confidence improve to its highest since last May. New products and expansion into new markets were key factors linked to confidence in the latest survey period.

(…) The effects of China’s policies to support domestic demand and the development of the trade war between the country and the U.S. will remain key to the prospects of the Chinese economy. Given that the government has refrained from taking policies of strong stimulus, the downward trend of the economy may be hard to turn around for the time being.

The IHS Markit Eurozone PMI® Composite Output Index edged lower in January, falling for a fifth successive month to register its lowest level for five-and-a-half years. After accounting for seasonal factors, the index recorded 51.0 in January, a little better than the earlier flash estimate of 50.7 but still down from 51.1 in December and signalling only weak growth in business activity.

image

Activity weakness was principally centered on France and Italy. Output in France was down for a second successive month, and at the fastest rate in over four years. imageMeanwhile, Italian private sector output deteriorated for the third time in four months and to the greatest degree in over five years.

Manufacturing was the primary source of output weakness during January. Whilst service sector growth was unchanged since December at around a four-year low, production in manufacturing rose only slightly and at the weakest rate in over five-and-a-half years of growth. Output growth in manufacturing was only sustained via the depletion of backlogs and stockpiling of finished goods (which rose at a series record rate).

Indeed, manufacturing new work declined to the greatest degree since April 2013 and was a primary reason for the first fall in composite new business for over four years. New work received by service providers was barely changed, rising only negligibly since December.

Job numbers continued to increase during January, maintaining a run of growth that begin in November 2014. Moreover, job creation was sustained across the single currency area, with the exception of Italy where a net fall in jobs was recorded for the first time since September 2015. Moreover, in line with the wider slowdown in activity and new work, overall euro area employment growth was the weakest in 28 months at the start of 2019. Increased capacity nonetheless helped to support the clearance of unfinished business.

Backlogs of work declined for a second successive month in January and to the greatest degree recorded by the survey since the end of 2014. Meanwhile, input prices continued to rise markedly in January. Wage and salary pressures drove operating expenses up in the service sector, but with price pressures easing in manufacturing (thanks to lower oil-related goods prices) overall input costs rose to the weakest degree in nearly a year-and-a-half. Increased costs nonetheless led to another increase in output charges, which rose in January at the strongest rate in three months.

Business confidence also improved to its highest in three months, though nonetheless remained subdued and around the lowest in four years. International trade tensions, Brexit and ongoing political tensions – both regionally and globally – continued to undermine sentiment.

The IHS Markit Eurozone PMI® Services Business Activity Index was unmoved on December’s 49-month low of 51.2 at the start of the year. France and Italy remained the primary sources of weakness, with both countries registering declines in activity during January. This was in stark contrast to Germany and Spain, where growth of activity improved in each case.

Latest data again suggested that overall growth of activity was supported primarily through the reduction of work outstanding, which declined to the greatest degree in over four years. New business volumes were broadly unchanged, rising at a negligible pace that was the weakest in fifty months of growth.

Jobs were again created during the month, although growth continued to slide. Easing for a fourth successive period, the degree to which employment rose was the weakest seen since the end of 2016.

Meanwhile, price pressures remained elevated in January. Operating expenses continued to rise at an above trend rate, placing ongoing pressure on margins. Although output charges continued to increase, and at the fastest pace in seven months, they did so at a pace that continued to noticeably lag that of input costs.

Finally, business confidence amongst service providers was a little firmer in January but nonetheless remained close to December’s four year low.

The PMI indicates that GDP is growing at a quarterly rate of just 0.1%, setting the scene for the region’s worst quarter since 2013. Such a weak start to the year would mean the current consensus forecast for 1.5% GDP growth in 2019 is likely to be revised lower, and hence lead to more dovish signals from the ECB.

What started as a manufacturing and export-led slowdown has shown increasing signs of infecting the service sector. The manufacturing PMI numbers are indicative of the goods-producing sector slipping into recession, while growth in services is now running at its lowest for four years. Worst may be yet to come: new orders received by factories are declining at the steepest rate for nearly six years and new business inflows into the service sector have stalled. Demand is consequently falling to an extent not seen since mid-2013. (…)

The deteriorating picture looks broad-based. Italy is in its steepest downturn for over five years and France has sunk into its sharpest decline for over four years. Faster growth in Germany and Spain meanwhile looks tenuous, as order book trends deteriorated in both cases. (…)

image

Clock The U.S composite PMI is out later this morning. Will review tomorrow.

WHAT’S GOING ON?

Amid all the gloom, these are strong gains:


SENTIMENT WATCH
Don’t Hold Your Breath for Big Stock Returns, Says Goldman Sachs Investors that didn’t profit from the equity rally in January may have missed out, according to the bank.

Lots of dry powder out there:

FOLLOW THE (AFTER TAX) MONEY:
Home Buyers Flee to Florida, as Brokers Credit Tax Savings

A growing list of public officials in high-tax states are expressing alarm that big earners are bolting to low-tax states as new data suggests some home buyers are moving in response to the year-old change in the federal tax law.

New York Gov. Andrew Cuomo became the latest on Monday when he blamed a $2.3 billion state shortfall on the new federal tax law that he said is driving people to leave the state. During a news conference in Albany, Mr. Cuomo said the 2017 law capping a deduction for state and local taxes at $10,000 is the reason for the deficiency. He specifically mentioned Florida as an attractive option for New Yorkers who are unhappy with the change in the tax law

Preliminary data show a jump in Florida home purchases by buyers from high-tax states. Home values in lower-tax areas have been rising faster than those in places where limiting the ability to deduct high state and local taxes eroded some of the savings from the federal tax reduction, according to an analysis by real estate and data firm Zillow. (…)

Mr. Cuomo, a Democrat, said someone in the top tax bracket in New York City already faced a combined tax rate of 45%, which would increase by 12% to 50.4% because of the tax-deduction changes. “A taxpayer in Florida would see no increase, probably would see a decrease, and Florida also has the advantage of no estate tax,” he said. (…)

New Jersey’s Department of the Treasury reported last month a 35% drop in income-tax revenue for December compared with the previous year, attributing the shortfall to changes in tax policy. In Connecticut, income-tax collections for December came in $75 million above projections. But going forward, the tax law changes and the poor stock market performance in 2018 could drag down revenues later in the year, Connecticut’s Comptroller Kevin Lembo said last week. (…)

Florida had the highest level of net domestic migration from July 2017 to July 2018, according to U.S. Census data released in December. New York was the largest overall population loser, followed by Illinois. (…)

Other low-tax cities are also doing well. Las Vegas and Phoenix have slowed a bit recently but still have the fastest home-price growth among major metropolitan areas, according to the S&P CoreLogic Case-Shiller home-price indexes. Brokers credit Californians fleeing rising home prices and tax changes. (…)

The law that went into effect at the start of last year cut federal income taxes for most Americans, though not everyone benefited equally. That is because the law capped the deduction for state and local income and property taxes at $10,000. The bill also capped the size of a loan on which mortgage interest could be deducted at $750,000, which hurts states with higher home prices. (…)

THE DAILY EDGE: 4 FEBRUARY 2019

RECESSION WATCH

It is always interesting to see how the same data can be read or interpreted so differently. Some people dig more than others, some are smarter than others and some also “talk their book” or their own bias. Or, like the Fed in recent months, some subtly switch their bias, from glasses half full to glasses half empty…This employment report lets everybody loose.

First, the influential WSJ:

  • Record Job Run Powers On Tested in January by a government shutdown and market volatility, the U.S. labor market added jobs for a 100th straight month.

Nonfarm payrolls rose a seasonally adjusted 304,000 in January, the Labor Department said Friday. The gain was well above last year’s average monthly job growth and showed that most private-sector businesses shrugged off the shutdown and kept on hiring. (…)

The unemployment rate rose to 4.0% last month from 3.9% in December. The Labor Department said the shutdown caused thousands of federal workers to be counted as on temporary layoff, contributing to the uptick. The rate has edged up the past two months since touching a 49-year low of 3.7% last fall. (…)

Hiring last month increased in nearly every major category. The leisure and hospitality sector, including restaurants, added 74,000 employees. Construction firms hired 52,000. The manufacturing, health-care and retail sectors also added jobs. The federal government added 1,000 jobs, despite the shutdown.

Furloughed federal workers were counted on payrolls in January because they received back pay for the time they missed, the Labor Department said. Since those workers didn’t report to work at all during the survey week, the week that includes the 12th of the month, many were counted as unemployed due to temporary layoff, in a separate survey of households that determines the unemployment rate. That helped push the jobless rate to the highest level since June 2018. (…)

The report also showed that a broader measure of unemployment, which includes those too discouraged to look for work and those stuck in part-time jobs but who want to work full-time, rose to 8.1% in January from 7.6% the prior month. The rate, known as the U-6, was the highest since February 2018. The rate remains elevated compared with last time the headline unemployment rate stayed near 4%, suggesting some slack may still exist in corners of the labor market.

Still, the tight labor market is drawing workers off the sidelines, including those with disabilities, lower levels of education and criminal backgrounds. Friday’s report showed the share of American adults working or looking for work rose to 63.2%, up a half percentage point from a year earlier. (…)

The widely read NYT and Bloomberg:

The excellent David Rosenberg:

David, currently sporting his ursid outfit, sees things with a darker hue, noting the low payroll diffusion index (61%) and the sharp deceleration in manufacturing employment gains with January’s +13k being the weakest figure in 5 months. Add the 0.2% decline in the factory workweek and you get “the equivalent of a 31k decline in manufacturing employment”.

High five The facts are that we have seen similar deceleration in the past 12 months without falling in the same manufacturing winter as in 2015-2017:

image

And the fact also is that the factory workweek had increased 0.2% in December and that it has been in the 42.0-42.2 range since May 2018, a rather high level historically, while manufacturing production looks reasonably healthy amid all the trade wars going on.

image

Markit’s U.S. manufacturing PMI report for January revealed that

Overall operating conditions across the U.S. manufacturing sector improved in January, supported by faster expansions in output and new orders. Domestic demand drove new business growth (…). Business confidence about the year ahead also picked up markedly to reach a three-month high. Meanwhile, goods producers increased their workforce numbers strongly amid a quicker rise in new orders. (…) the upturn in new orders accelerated and was steep overall.

Still, David warns that “at turning points in the cycle, it is the Household survey that leads, not the Payroll survey.” Household employment “plunged 251k in the first decline in five months. While some of this can certainly be attributed to the government shutdown, the nonfarm private sector job tally sagged 130k.” He also notes that “employment among the “bread winner” class [25-54Y] declined for three months in a row.”

Factual, but this is a highly volatile series. The 105k bread winning jobs lost in the last 3 months are rather small (0.1% of the total), especially coming after the 559k October 2018 jump. Note that this series provided no advance warning in 2007. Employment in that age cohort was up 1.1% YoY in January, well within its range since 2014.

image

Rosenberg also notes that full-time employment dropped 76k in January. “This is a reason to rejoice?”. Certainly not, although we should all be happy for the other 1.26 million who found a full-time job during the previous 4 months. Note again that this series, like most employment data, is a poor leading indicator.

image

Smart National Bank Financial warns us that “temporary employment (a good leading indicator) was roughly flat”. To be monitored.

image

Finally, David Rosenberg highlights the fact that the unemployment rate, at 4.0%, is up 0.3% from its 3.7% cycle low and that “the mean, median and mode is for the jobless rate to rise 0.4 of a point from the low by the time the recession hits. We are now three-quarters there. Data back to 1950 shows that at no point in the past did we see a 0.6 point increase off the trough without seeing a NBER-defined recession”.

This is true with the only possible exception being June-Nov. 1959 when the U3 rate rose 0.8 points before falling back to a new low in Feb. 1960, two months before the recession (!). However, there have been six occasions since 1950 when the U3 rate rose 0.4 or 0.5 points without being followed by a recession.

The humble Edge and Odds:

The American consumer being the only solid pillar for the economy currently, the fact that Weekly Payrolls (employment x hours x hourly earnings) keep rising nicely (+5.7% YoY in January) while core inflation is muted (+1.9% in November) makes me think that the economy is in no immediate danger. Add the low oil prices and near zero food-at-home inflation, discretionary spending should remain solid for a while.

image

Fed’s Kaplan: Fed Likely On Pause Until At Least Summer
U.S. Light Vehicle Sales Dip

The seasonally adjusted, annualized rate of sales for January came in at 16.9 million, down from 17.22 million in January 2018 and December’s 17.72 million rate, and marked the first month the SAAR has dropped below 17 million since August. (…)

January is typically one of the lowest months of the year for industry sales, with the least bearing on the year’s final results. (…)

January proved an early challenge for an industry that, according to most forecasts, is expected to fall short of 17 million annual sales for the first time since 2014. And those forecasts came before the 35-day U.S. government shutdown left 800,000 federal workers without paychecks, and record-setting cold kept millions of Americans bundled up at home during the last week of the month. (…)

Global PMI sinks to near two-and-a-half year low at start of 2019

Growth of the global manufacturing sector slowed closer to stagnation in January. At 50.7, the J.P.Morgan Global Manufacturing PMI™ – a composite index1 produced by J.P.Morgan and IHS Markit in association with ISM and IFPSM – fell for the ninth straight month to its lowest reading since August 2016.

image

(…) if US data were excluded from the Global Manufacturing PMI calculation the reading would have been 50.0, a level signalling stagnation. The slowdown in China imagemanufacturing was the main drag, as the China PMI fell to a near three-year low. The euro area and Japan PMIs fell to 50- and 29-month lows respectively. (…)

This mainly reflected a near-stalling in the rate of growth in new orders, as new business rose at the weakest pace during the current six-year sequence of expansion. New export work decreased for the fifth straight month and to the greatest extent since May 2016.

image
What CEOs Are Saying About the Possibility of a Recession

(…) While business leaders don’t forecast a downturn, several saw the potential for recession and slowing growth on conference calls during the past week, from automakers to staffing firms. (…) Analysts surveyed by Bloomberg over the past week see a median 25 percent chance of a slump in the next 12 months, up from 20 percent in the December survey. (…)

The Conference Board CEO Business Confidence Index is as gloomy as it gets outside of recessions. These CEOs are obviously not the same as those polled by CEO Magazine nor the Business Roundtable who are more in tune with CFOs as these charts from RBC Capital illustrate:

image

Small businesses:

imageEconomic confidence among CEOs continued to decline according to the Q4 2018 survey, reversing all of the gains recorded since the election of President Trump. The Vistage CEO Confidence Index was 95.4 in Q4, down from 103.0 in Q3 and last year’s fifteen-year peak of 110.3. The plunge was due to weakening evaluations of the national economy. Fewer CEOs reported that current economic conditions had improved (44%) compared to last quarter’s 64%. Even more notable is the drop in the increase of CEOs who expected the economy to weaken more than it will strengthen during the year ahead. (Tariffs were reported to have a negative impact by 38% of firms).

When asked about prospects for the national economy in the year ahead, just 14% anticipated improvement, down from 25% last quarter and 45% a year ago. (…) 33% of CEOs reported a pessimistic outlook for the economy in the coming year, which was the highest level since the start of the Great Recession. However, this negative economic outlook was still well below the 51% recorded in Q4 2007 or the 61% in the Q4 2018.

The proportion of firms who expected gains in revenues fell to its lowest level in two years, although gains were still expected by seven-in-ten firms. The slide during the past year has been large, with the proportion who expected gains falling to 70% from last quarter’s 75% and last year’s 83%. Planned investment spending also declined in the recent survey. Increased spending on fixed investments fell to 43%, down from 50% last quarter and 54% last year. Few firms, however, planned actual cutbacks — just 8%. (… )

Increases in the total workforce are planned by 65% of all firms, and while these expansion plans are down from the fifteen year peak of 75% set in the prior quarter, it was still higher than any other survey since mid-2003.(…) Profit expectations remain strong despite softening of anticipated revenues, largely due to the fact that 54% of CEOs plan to increase the prices of the products or services in the year ahead. (…)

Junk-Debt Sales Jump, Easing Credit Fears

Since Jan. 10, companies with below-investment-grade ratings, including TransDigm Group Inc. and Dun & Bradstreet Corp. , have sold around $50 billion of bonds and loans, breaking a dry spell that saw just $29 billion of speculative-grade debt sold in November and December, according to LCD, a unit of S&P Global Market Intelligence. (…)

As companies sold a hefty amount of debt in recent weeks, they have been forced in several cases to lean on one particular kind of debt—secured bonds—which is garnering more investor interest than secured loans and unsecured bonds. (…)

EARNINGS WATCH

Factset:

Overall, 46% of the companies in the S&P 500 have reported earnings to date for the fourth quarter. Of these companies, 70% have reported actual EPS above the mean EPS estimate, 7% have reported actual EPS equal to the mean EPS estimate, and 23% have reported actual EPS below the mean EPS estimate. The percentage of companies reporting EPS above the mean EPS estimate is below the 1-year (77%) average and below the 5-year (71%) average.

In aggregate, companies are reporting earnings that are 3.5% above expectations. This surprise percentage is below the 1-year (+6.0%) average and below the 5-year (+4.8%) average.

The blended, year-over-year earnings growth rate for the fourth quarter is 12.4% today, which is above the earnings growth rate of 10.9% last week.

In terms of revenues, 62% of companies have reported actual sales above estimated sales and 38% have reported actual sales below estimated sales. The percentage of companies reporting sales above estimates is below the 1-year average (72%) but above the 5-year average (60%).

In aggregate, companies are reporting revenues that are 0.8% above expectations. This surprise percentage is below the 1-year (+1.4%) average but above the 5-year (+0.7%) average.

The blended, year-over-year revenue growth rate for the fourth quarter is 6.6% today, which is above the revenue growth rate of 6.2% last week.

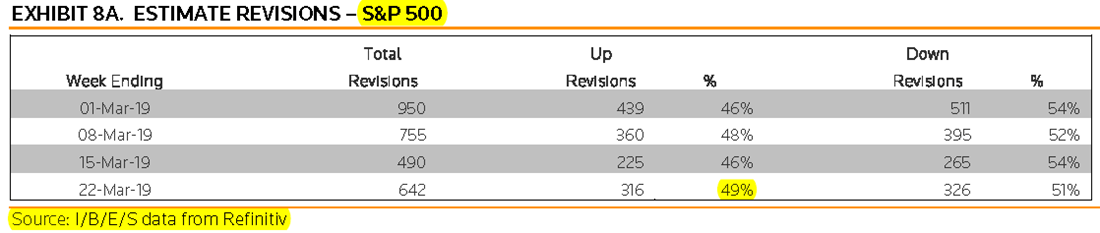
Refinitiv’s data put Q4 earnings growth at 15.5%, pretty close to the 15.8% growth rate expected on Jan. 1 (12.9% ex-Energy). Analysts continue to trim their estimates across the board:imageimage

At this point in time, 42 companies in the index have issued EPS guidance for Q1 2019. Of these 42 companies, 33 have issued negative EPS guidance and 9 have issued positive EPS guidance. The percentage of companies issuing negative EPS guidance is 79%, which is above the 5-year average of 71%. (Factset)

image

As a result, Q1’19 growth estimates have slipped to +0.7% from 5.3% on Jan.1 with 5 of 11 sectors expected to show negative growth rates. Full year 2019 forecasts are now for a 4.9% earnings growth (5.6% ex-Energy), down from 7.3% on Jan. 1. Full year revenues are seen rising 5.0% (5.5% ex-E).

Trailing EPS are now $162.25, still above the full year estimate of $161.49.

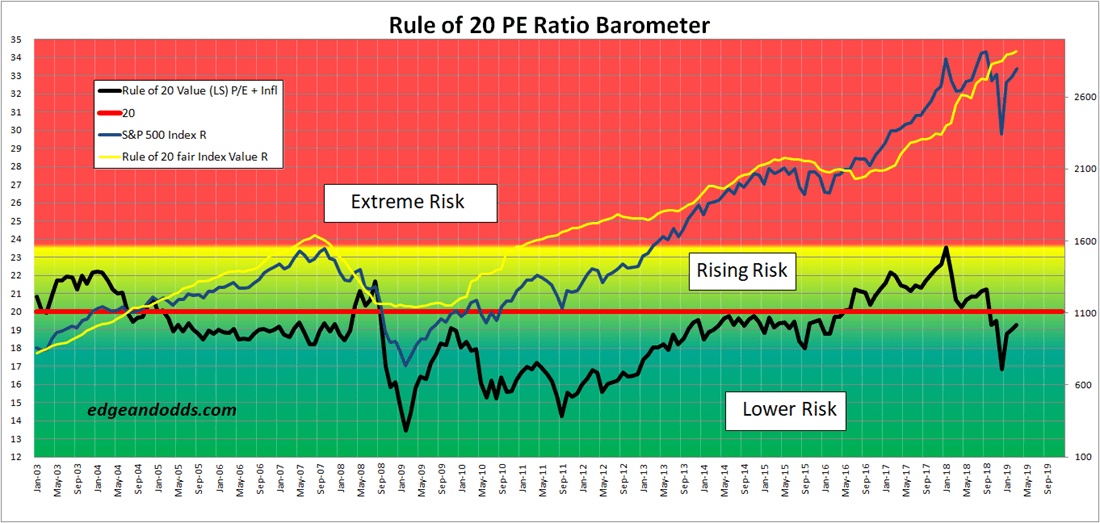
At 2700, the S&P 500 Index is trading at a 18.8 Rule of 20 P/E with Fair Value at 2888.

image
TECHNICALS WATCH

The S&P 500 Index is now only 1.4% below its 200-day moving average which has perked upward lately. Among other major country markets, only the TSX is showing a similar upturn in its 200dma.

spy

U.S. mid and small cap indices still show declining 200dma. The Nasdaq 100 Index, however, has also reversed the decline in its 200dma and its equal weight sub-index is even above the line indicating good breadth.

ndxe

Lowry’s Research says that its analysis of Supply and Demand “suggests a rally even stronger than implied by the gains in price.” There has been a sharp reversal in the spread between Demand and Supply since the December lows and that spread has crossed above its 40-week m.a.. “So far in this bull market there have been three prior crosses in the spread from a depressed level – in Aug. 2009, Dec. 2012 and Nov. 2016. Each cross was followed by a sustained market rally.”

But Joe Public has ben scared:

MORAL SUASION
Confused smile Foxconn Says It Will Move Forward With Wisconsin Plant After Conversation with Trump Foxconn, a major supplier to Apple, said it has decided go ahead with the construction of a liquid-crystal display factory in Wisconsin, two days after saying building such a plant would be economically unfeasible.

Call me Was there also a phone call from Mr. Xi?