The enemy of knowledge is not ignorance, it’s the illusion of knowledge (Stephen Hawking)

It ain’t what you don’t know that gets you into trouble. It’s what you know for sure that just ain’t so (Mark Twain)

Invest with smart knowledge and objective odds

THE DAILY EDGE: 16 JANUARY 2019

Today’s retail sales data for December will not be available because of the government shutdown, but based on the Redbook same-store index, holiday sales were relatively healthy. (The Daily Shot)

Source: Pantheon Macroeconomics

U.S. Producer Prices Decline Led by Lower Energy Costs

The headline Final Demand Producer Price Index using new methodology fell 0.2% during December following a 0.1% uptick in November. A 0.1% decline had been expected in the Action Economics Forecast Survey. From December-to-December, the index rose 2.5%, the same as during 2017. Producer prices excluding food & energy eased 0.1% after a 0.3% increase. A 0.2% gain had been anticipated. For the year, the core PPI rose 2.7% after rising 2.2% in 2017. The PPI excluding food, beverages and trade services is another measure of underlying price inflation. It held steady last month (2.8% y/y) following a 0.3% increase. It’s 2017 rise was 2.3%.

The PPI using the old methodology fell 0.3% during December (+1.4% y/y) following a 0.8% November decline. Prices excluding food & energy improved 0.1% last month (2.5% y/y) after rising 0.3% in November. (…)

image

Core PPI rose 2.0% annualized in Q4 with a weak finish. Core Goods prices are up 1.6% a.r. in Q4, also with a weak finish.

image

Empire State Manufacturing Activity Weakens Sharply

The Empire State Manufacturing Index of General Business Conditions declined to 3.9 in January, the lowest level since May 2017. The Action Economics Forecast Survey expected a reading of 12.0 for January. Data back through 2017 were revised. The Empire State data, reported by the Federal Reserve Bank of New York, reflect business conditions in New York, northern New Jersey and southern Connecticut.

Haver Analytics calculates a seasonally adjusted index that is comparable to the ISM series. The calculated figure fell sharply to 51.9 from 56.2. It was the lowest level in two years. During the last ten years, the index has had a 66% correlation with the quarter-to-quarter change in real GDP.

Deterioration in the component series was broad-based last month and led by much lower orders, delivery times and inventories indexes. The shipments and unfilled orders indexes also fell sharply.

The employment index fell significantly during January after showing strong hiring in December. A lessened 15% of respondents reported increased employment, while a steady eight percent showed a decrease. The series dates back to 2001. During the last ten years, there has been a 77% correlation between the employment index and the month-to-month change in factory sector payrolls. The employee workweek reading was little changed.

The prices paid index weakened to the lowest level since December 2017. Forty-one percent of respondents indicated increased prices this month, while a higher six percent reported a decrease. Prices received held steady at the lowest level since December 2017.

The series measuring expectations for business conditions in six months fell sharply to the lowest level in nearly three years due to declines in most categories.

 large image large image

Banks Flash Warning on Economy The latest signs of weakness in the U.S. economy come from big banks JPMorgan Chase and Wells Fargo

(…) JPMorgan reported growth of 1% from a year earlier in commercial and industrial loans, down from 4% in the prior quarter, which Chief Financial Officer Marianne Lake said was partly because the bank had pulled back from lending in particular areas and partly because of a general slowdown in the economy.

The bank also increased loan-loss reserves in its commercial-banking book moderately. On a conference call, Ms. Lake characterized the reserve build as being in “a handful of names in a handful of sectors, nothing that points to a systematic deterioration in a particular sector.” (…)

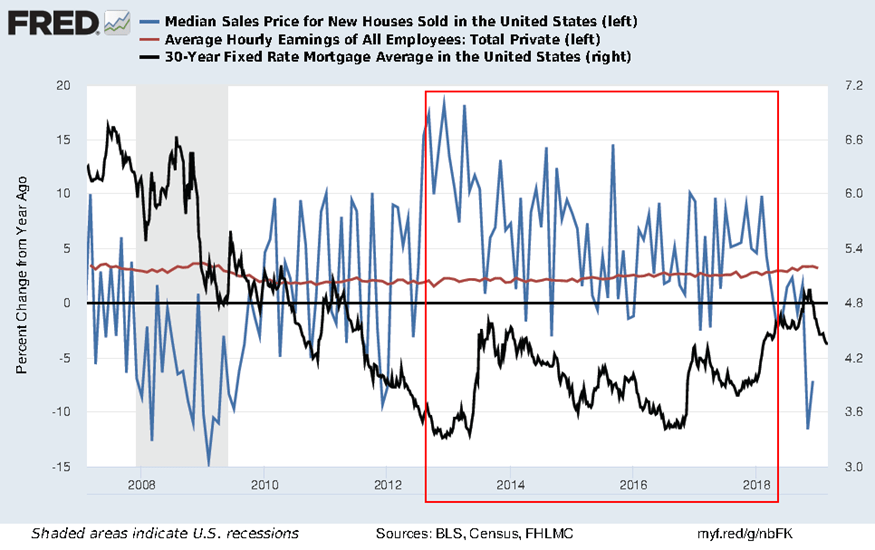
Meanwhile, at Wells Fargo there was a 5% jump in commercial and industrial loans, which was an encouraging sign after relatively weak momentum in this business for the past few quarters. But total loans outstanding at the end of the year were still down slightly from a year earlier. Notably for the biggest mortgage lender in the country, mortgage originations fell by 28% from a year earlier, the latest signal of weakness in the U.S. housing sector.

High five Fact is that bank lending has been pretty good lately. It’s off a weak base but Q4 lending is up 8.0% YoY and December up 9.7%.

image

BTW: JPMorgan CEO James Dimon said on a conference call with reporters that if the government shutdown lasts through the first three months of 2019, that could send U.S. economic growth to zero. (…)

Source: @GregDaco, @OxfordEconomics (via The Daily Shot)

(…) In addition to those 800,000 workers, a much larger number of government contractors is going without pay. The shutdown is reducing payments to contractors by about $245 million a day, or about 0.4 percent of daily gross domestic product. Some estimates put the number of workers who will be affected at more than 4 million — and unlike government employees, contractors won’t receive backpay once the shutdown ends.

Together, those 4 million contractors and the 800,000 furloughed employees constitute about 3 percent of the country’s labor force. That number is heading into territory that could have macroeconomic implications — for comparison, the increase in unemployment in the typical recession is usually about 2 percent to 4 percent. Furloughed workers and unpaid contractors are not quite the same as unemployment, but the macroeconomic spillovers might be comparable. (…)

Companies might delay investment due to regulatory disruptions — already there are ominous signs. Thanks to the lack of government workers to grant regulatory approval, new products from aircraft to beer to trucks can’t be released. That uncertainty will almost certainly give companies pause about investing. If anxieties about the decline in demand due to the shutdown make companies even more reluctant to invest, the result could be that many businesses stampede for the exits. And since many businesses serve other businesses, a lack of investment could quickly ripple through the supply chain. A general slowdown in business activity would result, with the attendant layoffs, pay freezes and cuts — in other words, a recession. (…)

U.S. Home Sales Plunged in December, Price Growth at 6-Year Low Previously hot metropolitan areas are cooling fast.

The median home price rose to $289,800 in December, a gain of 1.2 percent, the slowest monthly pace since March 2012. Sales dropped by almost 11 percent, the biggest decline for any month since 2016, Redfin said. Previously hot metropolitan areas are cooling fast. Prices dropped 7.3 percent in San Jose, California. (…)

Redfin’s data, which covers many large metropolitan areas, represents closed sales. Buyers likely signed contracts in November for most December sales. While rates for 30-year mortgages peaked at 4.94 percent in November, climbing a percentage point since the start of 2018, they’ve since fallen to 4.45 percent.

Goldman Says Rich People Will Drag Down the U.S. Economy The stock market sell-off means they’ll be spending less.

(…) Lower equity prices could take half a percentage point off U.S. gross-domestic product growth in 2019, with overall tighter financial conditions restricting expansion by around 1 percentage point, Goldman economist Daan Struyven wrote in a note Tuesday. (…)

Struyven argued against the idea that the wealth effect from the stock market might be limited due to a higher concentration of stock ownership than in previous decades, and a lower propensity to spend among rich households. To prove that this thesis doesn’t hold up, he cited increases in equity holdings, as well as a high sensitivity of luxury-goods spending to stock-market fortunes, as evidence.

That’s at odds with a paper from the National Bureau of Economic Research in 2013 that finds “at best weak evidence of a link between stock-market wealth and consumption,” and asserts that the housing market has much more of a wealth effect.

The share of personal consumption expenditures spent on jewelry is “highly correlated with moves in the stock market,” Struyven wrote in the Jan. 15 report. (…)

image

China injects record $84bn to boost economy Central bank acts on growth fears and higher lunar new year cash demand

(…) The finance ministry also issued new quotas for local government bond sales earlier than normal this year to ensure that infrastructure projects are adequately funded.  A senior finance ministry official on Tuesday provided details on new tax cuts designed to support small businesses, manufacturers and exporters.

Trade War Tops Global Risks for Business Leaders

(…) “We simply do not have the gunpowder to deal with the kind of slowdown that current dynamics might lead us towards,” said Børge Brende, president of the World Economic Forum.

Economic policy, once a way for rivals to mutually benefit in trading relationships, is now “frequently seen as a tool of strategic competition,” the report said. (…)

“The biggest risk is the lack of willingness to collaborate—we are not mitigating that risk,” the group’s chief said. (…)

EARNINGS WATCH
Earnings: First, the Good News Corporate results are likely to be a lot better than analysts expect in the fourth quarter

(…) For one thing, despite Apple, earnings warnings have been muted. By Refinitiv’s count, the ratio of companies with negative earnings pre-announcements to those with positive pre-announcements is 1.5—well below the long-term average of 2.8. In the third quarter, the negative-to-positive ratio was 1.4, and eventual earnings growth ended up at 28.4%, versus the 21.6% analysts expected at quarter end.

Another plus: Among the admittedly small number of companies that already have reported results, some 85.2% have topped estimates. That compares with 64.5% historically and 78% over the past four very strong quarters. (…)

The first quarter could be a different matter, though. The effects of the government shutdown and ongoing trade disputes are expected to weigh on the economy and the boost to earnings growth from the tax cut is going away.

While they are unveiling good numbers, companies will be discussing all this on their earnings calls—so don’t relax too much.

It’s been a while I had not seen a positive spin on earnings. The most recent facts:

As of yesterday, we have had 27 earnings reports boasting an 85% beat rate. Financials are 50% with only 4 reports in but the two misses were enough to bring the surprise factor down from +3.3% to zero.

Q4 earnings are seen up 14.0%, down from 15.8% on Jan. 1.

Trailing EPS are now $162.05, slightly above the full year estimate of $161.65.

Q1’19 earnings are now seen up 3.3%, down from 5.3% on Jan. 1 while Q2’19 earnings are expected up 5.1% (6.5%).

U.S. middle-market private companies enjoyed the strongest earnings growth in years, propelled by high demand for products and services, according to a report released Friday by Golub Capital, a lender to these firms.

Closely held smaller companies reported that earnings rose 13.4% in the first two months of the fourth quarter compared with the same period in 2017, the fastest such increase since at least 2012. Revenue rose by 10.6% during the first two months of the fourth quarter, the report said.

“Unless you are a business that’s driven by commodity prices, you are doing great,” said Lawrence Golub, chief executive of Golub Capital. “There is a lot of momentum going to 2019; it looks as if nothing could derail that.” (…)

Some sectors analyzed by Golub Capital, such as manufacturers, feel the pressure of higher steel prices. “We see margin compression in the industrial sector,” Mr. Golub said. “This sector is most sensitive to cost increases coming from trade issues.”

The report is based on the Golub Capital Altman Index, which assesses the median revenue and earnings growth of more than 150 closely held companies across the U.S. that Golub Capital lends to. The index, which was created in 2012, focuses on financial performance during the first two months of each quarter and measures earnings before interest, tax, depreciation and amortization. (…)

THE DAILY EDGE: 15 JANUARY 2019: Recession, Earnings, Technicals Watches

RECESSION WATCH

Speaking to all the talk about the U.S. falling into recession, I see no evidence that will occur anytime soon barring some kind of black swan event. Many recession pundit predictors point to the yield curve, referencing an inversion of the 2-year T’note to the 5-year T’note, or the 2-year T’note to the 10-year T’note. To us, these are the wrong yield curves. During our 48 years in this business the correct yield curve has always been the 90-day T’bill to the 30-year T’bond and it is nowhere near inversion. Junk bond spreads, while they have widened, remain tighter than they have been prior to recessions. The Leading Economic Indicators (LEI) have always peaked months before the start of a recession and the LEI is still rising. Household debt-to-disposable income has declined, incomes are rising, corporate balance sheets are strong, the Present Situations Index – which has telegraphed every recession – is still rising, and the list goes on. Accordingly, I just do not see why so many folks are thinking a recession is coming. (J. Saut, Raymond James)

Yellen Warns Anecdotal Signs Show Businesses Pausing on Spending Outside the numbers, some cracks are starting to emerge in the economy.

(…) “We’re hearing anecdotal reports’’ about “businesses beginning to put investment plans on hold because of the uncertainties they face in the global environment and around supply chains and trade,’’ Yellen said Monday at the annual gathering of retail-industry professionals. A “tightening of financial conditions, the drop in the stock market, the strong dollar, higher corporate borrowing rates — that could slow the economy as well as having some real feedback effects.’’ (…)

“He [Powell] shouldn’t tighten so preemptively that he causes a recession or brings this expansion to an end,” Yellen said. “If he’s not a little bit careful, history could repeat itself.”

Global auto leaders urge Trump administration to end trade turmoil Auto executives gathered in Detroit on Monday called on the Trump administration and Congress to resolve trade disputes, and end the government shutdown, saying political uncertainty is costing the industry.

(…) U.S. officials are weighing so-called Section 232 national security tariffs on imported vehicles. That tariff would not hit U.S.-made models, but some analysts warn it could trigger a sales slump as prices for European and Asian-made models jump.

China’s gloomy trade could spill to global economy

“The decline in volumes could be larger than a recession would produce,” Jonathan Smoke, an economist with auto market information company Cox Automotive, said during a briefing on Sunday.

Volkswagen AG (VOWG_p.DE) CEO Herbert Diess on Monday announced the German automaker would invest $800 million in its Chattanooga, Tennessee, plant and add 1,000 jobs to build electric vehicles as it faces pressure from the Trump administration.

VW is worried the Trump administration will move ahead with new tariffs and hopes the new investments will help the German automaker avoid them. “We have strongly been encouraged to invest more, which we will do,” said Diess, who met with Trump last month. (…)

Volkswagen is building the first dedicated EV production facility in Zwickau, Germany, starting MEB production by the end of 2019.

Volkswagen will add EV production at facilities in Anting and Foshan, in China, in 2020, and in the German cities of Emden and Hanover by 2022.

China’s Exports Take a Surprising Fall in December The Trump administration’s trade tactics dent another growth driver, as exports decline 4.4% from a year ago.

(…) In November exports grew 5.4%, and many economists predicted the run would continue last month and then fade in 2019. (…) China’s imports, which have been weakening, fell 7.6% in December, according to Monday’s trade data. Mr. He, the economist, said that global demand is flagging more than expected and that that will exert more downward pressure this year on the slowing Chinese economy. (…)

Despite December’s fall, China’s exports rose 9.9% for the full year of 2018, beating a 7.9% increase in 2017, while imports surged 15.8% on year, on par with 2017’s growth. The strong performance, in part based on resilient demand from the U.S., gave China another record annual trade surplus with the U.S., of $323.3 billion, despite the tariffs the Trump administration wants to use to address the imbalance.

The frontloading of orders in 2018’s export boom portends weaker performance in 2019, some economists said. (…)

The world’s second-largest economy will aim to achieve “a good start” in the first quarter, the National Development and Reform Commission (NDRC) said in a statement, indicating the government is ready to counter rising pressure on growth. (…)

Premier Li Keqiang said China achieved its key 2018 economic targets, which were “hard-won,” and seeks a strong start to the economy in the first quarter to establish conditions helpful to meeting this year’s goals, according to state television on Monday.

Sources told Reuters last week that Beijing was planning to lower its growth target to 6-6.5 per cent this year after an expected 6.6 per cent in 2018, the slowest pace in 28 years. (…)

Aggregate financing was 1.59 trillion ($235 billion) in December, the People’s Bank of China said on Tuesday. That compares with an estimated 1.3 trillion yuan in a Bloomberg survey. (…) Aggregate financing was 1.59 trillion ($235 billion) in December, the People’s Bank of China said on Tuesday. That compares with an estimated 1.3 trillion yuan in a Bloomberg survey. (…)

Germany Dodges Recession With ‘Slight’ Growth in Fourth Quarter

There was a “slight” increase in gross domestic product in the three months through December, according to the Federal Statistics Office, which will publish official figures next month. But the quarter rounded out a year in which overall growth was the weakest since 2013.(…) “We expect a small plus,” she added, cautioning that the estimate is preliminary and based on only about half the information for the quarter. (…)

In 2018 as a whole, Germany’s gross domestic product increased 1.5% from a year earlier, down from 2.2% the previous year and its slowest annual growth rate since 2013, the agency said.

The slowdown will cast a pall over growth prospects in other parts of Europe, some of which supply parts to German automobile manufacturers and other large exporters. (…)

China is a particular concern because it is Germany’s biggest trading partner and a key driver of German corporate profits. (…)

Germany is the world’s third-largest exporter, and its fortunes are intertwined with those of other major economies. Economists at the World Bank last week nudged down their forecast for global economic growth this year, but recent indicators suggest there is a risk of a sharper slide.

OECD Sees Further Slowdown in Global Economy This Year Gauges of future economic activity suggest some cooling likely in the U.S. this year

(…) “In the United States and Germany, the tentative signs of easing growth momentum, that were flagged in last month’s assessment, have been confirmed,” the Paris-based research body said. (…)

The U.S. indicator fell for the third straight month, and to 99.6, further below the 100 mark that points to steady growth. By contrast, China’s indicator rose slightly to 98.8, a sign its slowdown may be coming to an end.

The leading indicator for the eurozone was below 100 for a fourth straight month, pointing to a continuation of the slowdown that began last year. (…)

Other signs of a broad-based slowdown in global economic growth aren’t hard to find. A measure of activity compiled for J.P. Morgan and based on surveys of businesses around the world fell to its lowest level in 27 months during December, with exports showing particular weakness.

image

Left hug Right hug U.S., EU Set Conflicting Goals for Trade Talks The U.S. and European Union are staking out sharply different goals for coming trade negotiations, raising the prospect for renewed trans-Atlantic commercial tensions.

The EU’s executive body will meet Tuesday to firm up the bloc’s parameters for talks expected to launch later this year. It is crafting a narrow mandate that would bar negotiations to reduce protections for Europe’s farmers.

“We have been very clear that from the EU side that we will not discuss agriculture,” European Trade Commissioner Cecilia Malmström said last week after meeting in Washington with her American counterpart, U.S. Trade Representative Robert Lighthizer.

Two days after that meeting, Mr. Lighthizer released the Trump administration’s “negotiating objectives” for the coming talks, declaring that a top priority is to “secure comprehensive market access for U.S. agricultural goods in the EU by reducing or eliminating tariffs.”

The 14-page document also calls for eliminating “non-tariff barriers” on U.S. agricultural products on the continent.

Influential U.S. lawmakers are also pushing back against Brussels’ determination to wall-off discussions about opening its food market.

“I don’t know how anybody in Europe that wants a free-trade agreement with us [can] expect it to get through the United States Senate if you don’t want to negotiate agriculture,” Iowa Republican Sen. Chuck Grassley, the new chairman of the Senate committee overseeing trade policy, told reporters last week. (…)

The stakes are high for the negotiations, in part because the administration has also threatened Europe with auto tariffs, saying its car exports may pose a national security risk.

The White House is expected to make public the global automotive tariff options it is considering by next month, but has promised to shield the EU from any potential levies as long as the EU-U.S. trade negotiations continue.

Good Times Are Turning Bad for Riskiest Borrowers Risky corporate debt markets have enjoyed a massive rebound at the start of 2019. But don’t be fooled into thinking the outlook has suddenly brightened. Junk-rated loans in particular still face the growth troubles that helped drive December’s selloff.

(…) Unless expectations of more rate rises suddenly return, investors aren’t likely to pile back into mutual funds and ETFs, which buy up at least one-fifth of new loans. An even bigger source of financing in loan markets is the structured funds known as collateralized loan obligations, or CLOs. Demand from these vehicles is driven by the cost of their own debt funding, especially the AAA-rated notes that tend to track yields on ordinary investment-grade bonds. A recent jump in those yields means new CLOs face higher costs and so need to buy higher yielding loans, according to Bank of America Merrill Lynch. (…)

This will not end well…

EARNINGS WATCH

Still very early. This is from RBC Capital Markets:

It’s now fair to say that downward revisions to 2019 S&P 500 EPS growth estimates have been a little worse than usual. (…) The magnitude of the downward revision is now tracking a little bit worse than the median and average downward revision that occurred from 2000 to 2017. The 2019 EPS growth rate is now expected to be 5.7% ($171 in Dollar terms, bottom up), down from 6.8% as of December 31 and 10% last summer. On a quarterly basis, S&P 500 EPS growth is expected to slow to 3.5% in both 1Q19 and 2Q19.

(…) Sell-side revenue growth estimates for 2019 have also continued to fall and are now tracking at 5%, slightly below the 5.1% growth rate anticipated in mid 2018 when we first began tracking the data. Revenue growth is currently expected to come in well below 2Q18–3Q18 levels in 4Q18 and throughout 2019, with the low point in the growth rate expected to be 2Q19. 

What we’ve learned so far [from management comments]. The tone around demand and the underlying backdrop has rattled US equity investors for good reason, with 13 companies describing conditions as healthy and 10 companies pointing to mixed or weak underlying conditions. Specific geographies are usually a source of the weakness, with more citations of European and specific European countries than China or Asia. On tariffs and the trade war with China, most companies commenting have suggested that the impact is manageable or minimal, or that it’s too early to tell, though a few have cited specific problems. On margin headwinds and cost pressures, commodities/raw materials and wages/labor continued to be the top complaints, while technology investments, marketing spend, and transportation//shipping also ranked high on the list, similar to 3Q18 reporting season. On cost-savings initiatives, a handful have made comments suggesting that their plans are receiving increased focus/acceleration, with headcount reductions and expanding use of IT being called out. On cash deployment, a handful of companies have noted greater emphasis on buybacks, capex, or debt paydown (fewer companies suggested that these are receiving less emphasis).

image image

Big Wage Gains Are Unlikely, San Francisco Fed Says Fed officials say the jobless rate, now near 4%, should fall even further this year, but bank economists haven’t seen the salary increases they expected.

(…) The San Francisco Fed paper took a look at state-level job markets, given that there have been episodes of sub-4% unemployment in some states. There is “little evidence supporting the contention that wage growth sharply rises as the labor market reaches especially tight conditions,” the paper’s authors write.

The paper says the state-level data suggest the interaction between unemployment and wages is linear, which means wages rise with falling unemployment in a pretty much steady relationship. Put another way, a steady improvement in unemployment means a steady improvement in wages, but no surges. (…)

“Geographical labor mobility—which can mute wage pressures in tight markets as workers are attracted to higher-wage areas—may be playing less of a restraining role” when the job market is very good nationwide, the paper noted.

Hmmm…

image

TECHNICALS WATCH

Did something significant just happened?

Lowry’s Research says so:

One 90% Up Day is a positive sign, but two or more 90% Up Days is even better in signaling the start of an important rally. Once again, the market obliged with not only a second 90% Up Day on Jan. 4th 2019, but a follow-up 80% Up Day on Jan. 7th. This combination of 90% and 80% Up Days represented the strongest burst of Demand since the rally off the so-called ‘Brexit’ low in late June 2016 and was much stronger than rebounds off prior market lows in mid and late Oct. 2018 and again in mid Nov. Overall, this combination of heavy selling followed by even stronger Demand appears to offer, according to the Lowry Analysis, a textbook example of a market bottom.

Market breadth was impressive and consistent not only with an important low for the major price indexes but also with an initial move higher that has been regularly followed by major market advances. In addition to the 90% Up Volume on the Dec. 26th rally, NY Advancing Issues were 90.8% of total Adv/Dec Issues. Such 9:1 ratios of Advancing to Declining Issues are extremely rare, occurring only 42 times since 1940 (out of 20,380 trading days). Historically, these 9:1 positive breadth days have been associated with rebound rallies that consistently developed into sustained advances.

And, the probabilities that 9:1 positive breadth is foretelling sustainable rallies are typically enhanced by evidence of strong follow-up breadth. Once again, the market has obliged by demonstrating a consistent powerful expansion in positive breadth with the recording of a ‘breadth thrust’ on Jan. 8th. Such breadth thrusts are also very rare, with only ten occurring since 1980. The most recent prior breadth thrust occurred on July 12th 2016, nine days after the ‘Brexit’ low which, as noted above, was the most recent prior instance of multiple 90% Up Days. It’s worth noting that, absent a brief hiatus to the pre-Nov. election low, the ‘Brexit’ low was followed by a rally that endured to the S&P 500’s Jan. 26th 2018 high.

In summary, over the past three weeks signs of exhausted Supply have been followed by the strongest Demand in over two years. This Demand has been supplemented by breakout breadth momentum associated with important market bottoms since at least 1980.

Charles Schwab’s Liz Ann Sonders adds this:

The reversal was so extreme that on two separate trading days since Christmas, volume in rising stocks was more than nine times the volume in declining stocks. This is a volume-modified trigger known as a Zweig Breadth Thrust.

Since that indicator’s creation, many technicians—including SentimenTrader (ST)—have more recently discovered the better fit of “volume” over “number of issues” when looking at the ratio of up-to-down issues on any given day.

When looking at the declines and attempted recoveries since stocks started their slide in late-summer 2018, what’s transpired in the few weeks since Christmas is markedly different than the ones that failed prior to that, according to ST.

In order for ST’s modified volume-based breadth thrust indicator to trigger, the 10-day exponential moving average of the up volume ratio needs to become oversold by diving below 40%; then increase enough to exceed 61.5% within two weeks. As you can see in the chart below, the thrust was triggered a week ago.

Source: Charles Schwab, SentimenTrader, as of January 11, 2019.

All of the prior signals are shown in the table below (those occurring amid a 52-week low for the S&P 500). There were a few notable failures in the mid-1970s as well as 2007-2008, but otherwise the median returns were fairly impressive. (…)

My December 26 post THE BULLY MEETS THE BEAR touched on most aspects of the investing decision but pointed out that, from a fundamental viewpoint (i.e. earnings and inflation), equity valuations was back in “Buy Low” territory:

A Rule of 20 P/E of 15 suggests a nearby floor and pretty positive risk/reward going forward.

image

At Monday’s close, the Rule of 20 P/E is 16.7 using trailing EPS of $160.50 (adjusted for the full 12 months of tax reform) and inflation of 2.1%. Earnings look solid in Q4 and we can safely expect trailing EPS to reach $162.50 by mid-March which sets the Rule of 20 P/E at 16.5. A possible decline in inflation below 2.0% would take the Rule of 20 P/E to 16.2.

It took 10 years for equities to go from deeply undervalued to overvalued (23.5 in January) and less than a year to retreat back to deep undervaluation.

image

image

That was at 2335 on the S&P 500 Index. We are now at 2575, 10.3% higher. But trailing earnings have jumped to $162.24 in the meantime. The Rule of 20 P/E is now 18.1 with the Index 11% undervalued from its “Fair Value” of 2888.

image

image

Some other considerations:

spy

  • 13/34–Week EMA Trend Chart