Trump to Delay Tariff Increases on Chinese Imports President Trump said he would delay an increase in tariffs on Chinese goods, citing what he called substantial progress on issues including intellectual property and technology transfer.
Mr. Trump’s tweets didn’t specify how long the extension of a trade truce would last or any date for a potential summit. (…)
A statement by the official Xinhua News Agency echoed Mr. Trump’s tweets, saying negotiations were centered on putting together the text of an agreement and that “substantial progress” has been made.
Mr. Trump tweeted the progress involved “intellectual property protection, technology transfer, agriculture, services, currency, and many other issues,” without offering details.
Previously, U.S. officials had said China had agreed to a currency accord. Beijing has recently tried to keep its currency from depreciating because of fears of capital flight. (…)
Millennials Are Facing $1 Trillion in Debt
Debt among 19 to 29-year-old Americans exceeded $1 trillion at the end of 2018, according to the New York Federal Reserve Consumer Credit Panel. That’s the highest debt exposure for the youngest adult group since late 2007.
Debt levels play a role in how young adults view their spending conditions, according to a University of Michigan survey Friday. Younger adults — those under age 35 — have reduced their spending compared with previous generations possibly because of weakened job prospects, delayed marriage and educational debt. (…)
A Surprise China Debt Default Upends Assumptions on Official Aid
Qinghai Provincial Investment Group Co., an aluminum producer that was seen by some analysts as a bellwether for assessing government support due to its struggles to make payments on offshore debt last year, had failed to wire funds for a coupon payment due Feb. 22 as of late afternoon China time. (…)
As recently as mid-December, S&P Global Ratings had removed QPIG from CreditWatch with negative implications, concluding that it would “continue to receive ongoing government support and be able to meet its short-term financial obligations over the next 12 months, despite its weak liquidity.” S&P rated QPIG at B+, four steps below investment grade. (…)
“QPIG is the largest aluminum producer in Qinghai province,” and was more than two-thirds owned by the provincial government, S&P analysts wrote in its report in December. “Its credit standing is important for the government because a default could reverberate throughout the value chain, including the power and coal industries.” (…)
EARNINGS WATCH
From Refinitiv:
- Through Feb. 22, 444 companies in the S&P 500 Index have reported earnings for Q4 2018. Of these companies, 69.1% reported earnings above analyst expectations and 23.0% reported earnings below analyst expectations. In a typical quarter (since 1994), 64% of companies beat estimates and 21% miss estimates. Over the past four quarters, 78% of companies beat the estimates and 15% missed estimates.
- In aggregate, companies are reporting earnings that are 3.0% above estimates, which is below the 3.2% long term (since 1994) average surprise factor, and below the 5.7% surprise factor recorded over the past four quarters.
- The estimated earnings growth rate for the S&P 500 for 18Q4 is 16.3%. If the energy sector is excluded, the growth rate declines to 13.6%.
- The estimated revenue growth rate for the S&P 500 for 18Q4 is 5.2%. If the energy sector is excluded, the growth rate declines to 4.5%.
- The estimated earnings growth rate for the S&P 500 for 19Q1 is -0.8%. If the energy sector is excluded, the growth rate improves to -0.2%.
Pre-announcements remain worse than at the same time in Q1’18 and Q4’18:

However, the last 2 weeks have seen 12 positive and 13 negative, almost a 1/1 ratio.
Analysts keep revising downward: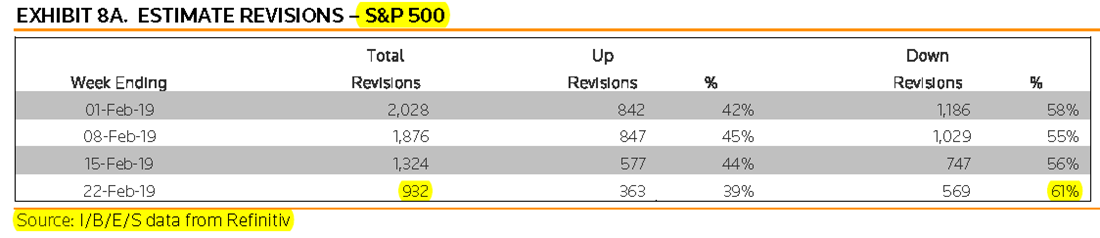

Kraft Heinz’s Goodwill Charge Tops Consumer-Staples Record
The $7.3 billion goodwill impairment Kraft Heinz Co. announced this week is the largest such write-down in the U.S. consumer staples industry in at least a decade, according to valuation firm Duff & Phelps LLC.
The size of the hit, disclosed Thursday, is unusual for the sector, which recorded 88 such write-downs between 2013 and 2017 totaling $9.6 billion, according to Duff & Phelps.
“This goodwill impairment alone is greater than that entire sector over the last three years,” said Carla Nunes, a managing director at Duff & Phelps.
The food maker’s write-down places it second behind General Electric Co.’s $22 billion goodwill write-off among the 10 largest write downs reported last year, she said. (…)
But KH’s recorded a total impairment of $15.9 billion for 2018 that included an $8.7 billion write-down to its intangible assets, particularly the Kraft and Oscar Mayer brands.. It will be interesting, and important, to see how each aggregator will treat these unusual charges. For KH, and Berkshire Hattaway which gets hit by the drop in value of its KH investment, they are truly operating charges. But from the overall market valuation standpoint, it seems best to exclude them from index earnings, although this will be strongly debated. The $15.9B is 1.2% of total S&P 500 profits for 2018.
SENTIMENT WATCH
History Shows Stock Rally Could Have More Legs U.S. stocks extended their winning streak to nine consecutive weeks and are on track for their biggest early-year advance in three decades, a dramatic turnaround that has given investors renewed faith in the nearly 10-year bull market.
(…) A more flexible approach to monetary policy from the Federal Reserve, easing U.S.-China trade tensions and a better-than-feared corporate earnings season have encouraged investors to ease back into the stock market, following the fourth quarter’s bruising selloff. (…)
“This year’s gains are consistent with investors being confident that nothing scary is on the horizon,” said Charles Lemonides, portfolio manager of ValueWorks LLC. “We’re in a ‘goldilocks’ place where the economy isn’t running too hot, so therefore the Fed likely won’t tighten policy further, and it’s not running too cool because we still have a strong labor market. And when it comes to trade, any news is good news.” (…)
Another bullish sign for stocks: The NYSE advance-decline line, a popular indicator of market breadth that tracks the number of stocks rising minus the number falling each day, has hit new highs. Meanwhile, 91% of S&P 500 stocks on Friday were trading above their 50-day moving average. (…)
“By having a much broader advance-decline line, that signals this is a rally that potentially has more legs.”
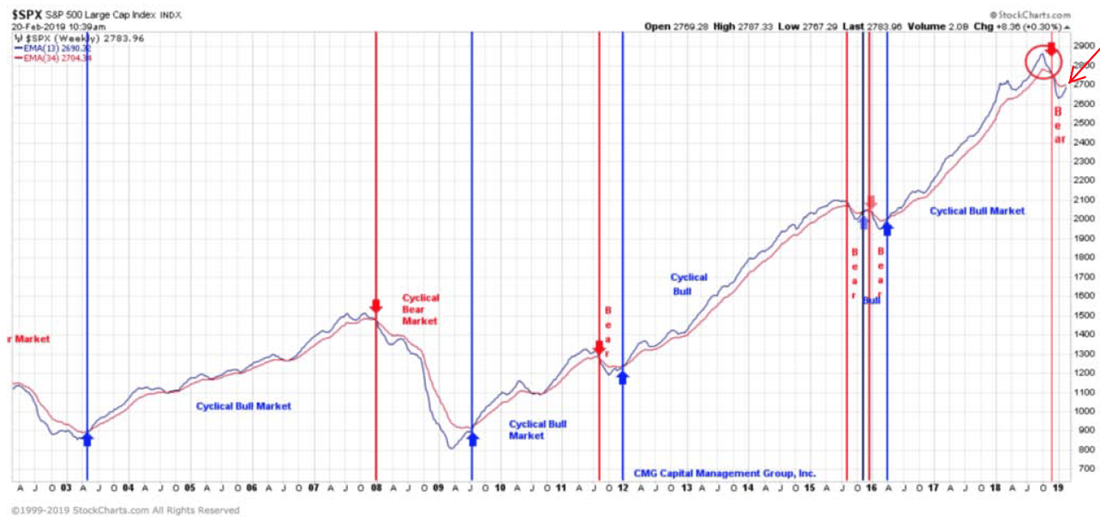
There are long legs…and short legs (chart from CMG Wealth):
Calm Blankets Markets From Stocks to Bonds, Even as Risks Remain Volatility measures in markets from stocks to currencies have retreated this year—a sign that investors are shedding caution even as uncertainties linger in the global economy.
-
Bad News Is Good News for Stocks Again
(…) The Fed sparked the current market rally when it signaled last month that it may be done with interest-rate rises for now. Any subsequent weak data has only served to raise hopes it would become still more dovish. In turn, an assumption has taken hold that other central banks around the world—especially in Asia—will feel less pressure to tighten policy.
The Fed’s apparent change of heart has overwhelmed everything else: All of the rebound in equity markets since Christmas has come on the back of rising valuations rather than improving corporate fundamentals. (…)
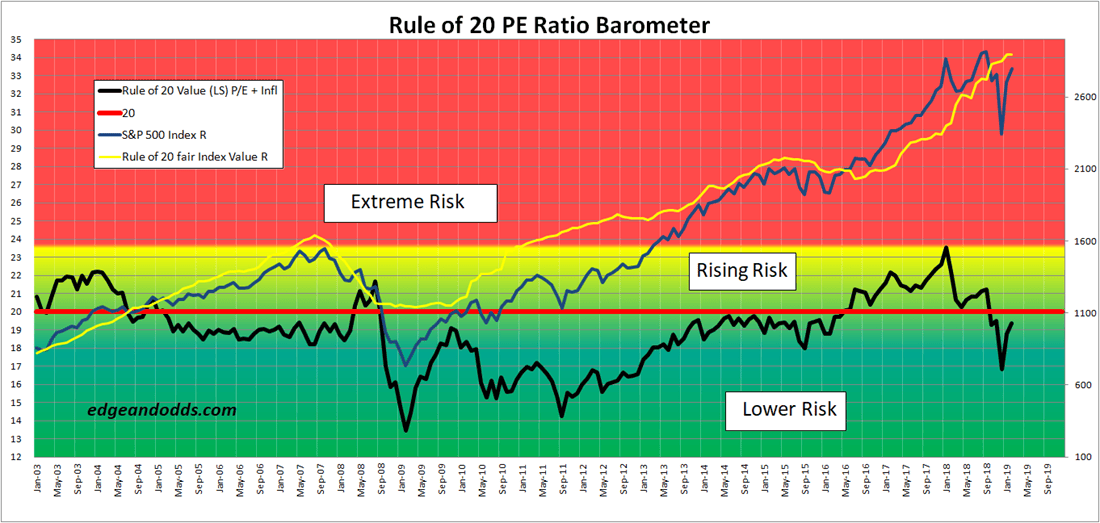
Partly true: the S&P 500 actual P/E on trailing EPS troughed at 14.6 on December 24 and is now 17.2. But earnings have also helped. Trailing EPS are up 1.4% from December and 22.4% YoY.
Since January 2018, equity valuations have gone from extremely high (23.5 on the Rule of 20) to extremely low (16.8) and are now back to almost “Fair Value” at 19.4. Unless Q1’19 profits strongly surprise on the upside, trailing EPS will flatline until mid-year at least. This would keep the Rule of 20 Fair Value (yellow line) stable around 2900 unless inflation slows measurably from its current 2.2%.
Obviously, an 18% jump in equity prices over 10 weeks fosters a lot of bullish writing. It is always good to mix some bear meat in our diet, especially when valuations are no longer cheap, profit growth seems to be stalling and world economics/politics are “challenging”. Here are two smart write-ups to keep us on our toes:
TECHNICALS WATCH
Lowry’s Research, which remained positive throughout the “correction/bear phase” continues to argue for “higher highs in the months ahead” given its reading of Supply and Demand conditions. “As of the Feb. 20th rally high in the S&P 500, Buying Power was at a new rally high and at its highest level since Aug. 22nd 2018 (and above its level at the Sept. 20th bull market high). Also as of Feb. 20th, Selling Pressure dropped to its lowest level since Sept. 27th 2018. Thus, the rally remains supported by strong intermediate term trends of expanding Demand and contracting Supply.”
Not a great fan of technical analysis, I must admit that Lowry’s approach is indeed different, more sensible and, so far, more useful than most other technical analysis that I have seen.
The signals from CMG Wealth’s 13/34EMA chart above have also proven very good over several cycles and a new “Cyclical Bull Market” cross could happen this week. Meanwhile, the important 200-day moving averages are also interesting to watch in many markets:
The S&P 500 is above its now rising 200dma and is set to retest the 2800 level which failed in October and November before failing miserably in December, each time with the Rule of 20 P/E about where it is now, which is very close to Fair Value”. We are simply back where we were after having been collectively scared by mundane stuff like Fed tightening, trade wars, earnings, D.C. and world politics. Just when valuation reached very undervalued levels below 17 on the Rule of 20 scale, the Powell pivot triggered a big sigh of relief after Christmas. Then Trump did his expected softening and the Q4 earnings season was ok. Back to square one.

This time, broader support may be coming from the Russell 2000…

…and the mid-caps:

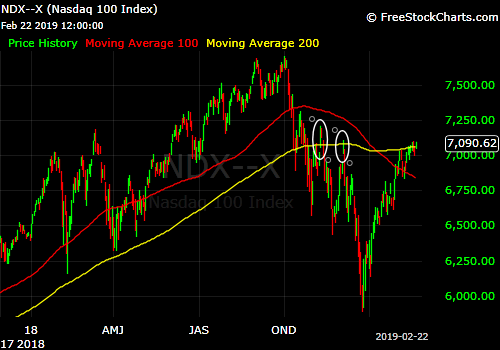
The Nasdaq 100 is also in testing mode…
…although its equal weighted clone has made no bones about the 3700 “resistance” and is only 1.8% below its all-time high:

Looking at sectors, all S&P 500 sectors are trading above their rising 200dma except commodity-sensitive Energy and Materials and, importantly, Financials which have yet to break their 2018 negative trendline:

Financials’ P/E peaked at 15.0 with the overall market in early 2018 and has since deflated to 11.4, an historically low range, as this Yardeni.com chart illustrates. Financials surprised negatively in Q4’18 (surprise factor –1.5%) but their profits nonetheless rose 14.6% on a rare 3.2% revenue decline. Analysts expect Financials to post rising profits throughout 2019 starting with +4.2% in Q1 accelerating to +21.1% in Q4. Their +9.3% growth forecast for the full year is only marginally lower than on Jan. 1 (+9.6%) while expectations for all S&P 500 companies were downgraded from +7.3% to +3.9%.

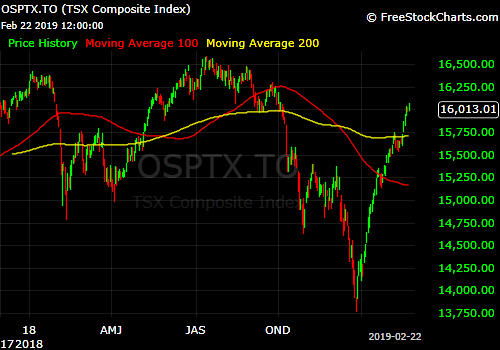
Among other major equity markets in the world, only the Canadian market is above its rising 200dma:
Emerging markets are back to their still falling 200dma:

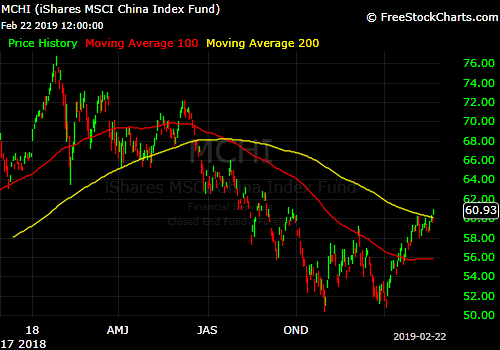
China is trying hard, however:


 Please note that due to the recent government shutdown, data for three US LEI components – manufacturers’ new orders for consumer goods and materials, manufacturers’ new orders for nondefense capital goods excluding aircraft and building permits – were not available for several of the recent months. The Conference Board has used its standard procedure of statistical imputations to fill in the missing data in order to publish a preliminary Leading Economic Index. The Conference Board will be issuing an interim release on March 4th, once these data are published.


