RECESSION WATCH
David Rosenberg is one of the best economists/strategists out there. David is bearish, seeing high recession odds which prompts me to be extremely watchful. Recessions are evil.
His latest handle is that the recent household employment survey, contrary to the payroll report, showed declining employment and this is supported by rising initial unemployment claims.
Those who claim the labor market is strong are focused more on lagging payroll reports and less in forward-looking jobless claims, which have risen to 54-week highs, and are behaving now in a fashion that is foreshadowing at the moment near-40% odds of a recession coming our way some time this year. (…) Actually, if you go back to the information gleaned from the payroll report, it didn’t tell you that the recession started in December 2007. But at the time, the rising trend in initial jobless claims did send the signal ahead of time – as it is doing now.
The first chart does not support Rosenberg’s views. Volatile household employment is not showing the downward trends it and the payroll numbers were showing in 2007, quite the opposite in fact in terms of YoY trends.

The MoM trends are also not too worrisome:

Initial claims did jump out of their channel a few months before the recession officially started in December 2007. Not there yet this cycle, are we?


Note that claims for the week ended Feb. 16 were release this a.m. and are dotted on the above chart. Weekly claims (red line above) were 216k, down 23k from the previous week. The 4-week moving average was 235,750, an increase of 4,000 from the previous week’s unrevised average of 231,750. Next week, the 4-week m.a. will lose the Jan 26 spike to 253k (shutdown?). Anything below 230k will return the 4-week m.a. within the channel.
Layoffs would presumably be less frequent and significant when hours worked remain in a sustained uptrend:
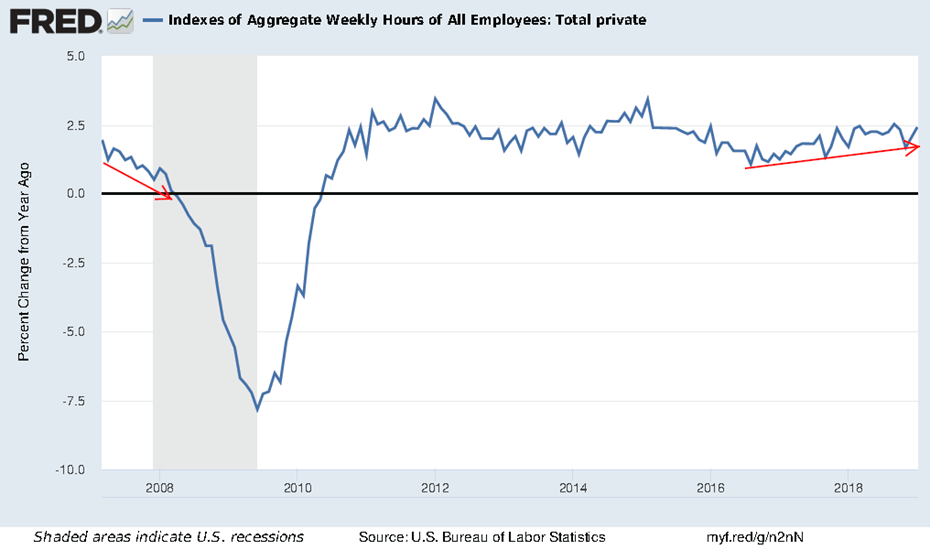
Lastly, claims are now only 1.3% of the labor force. How much higher does it have to get to before it starts to meaningfully impact consumption?

I would be a lot more worried about the American consumer if we had a repeat of the real income squeezers:

US Retail Sales Still Better Than Most
Last week, Retail Sales raised eyebrows as the December release came in with a horrendous print. Taking a step back and looking at sales from a global scale, though, US retail sales are still fairly strong compared to the other 23 major economies that we track through our Global Macro Dashboard. With a y/y growth rate of 2.3%, the indicator has a little bit of headroom above the average global rate of 2.16% and a full percentage point above the median global growth rate. In other words, while the December print wasn’t great—reasons to be suspect of the most recent data (see here and here) aside—and the indicator has been trending downwards in recent months, US Retail Sales are growing at a faster rate than 14 of the 23 global economies in our Dashboard. Of the developed economies tracked, the US actually has the fourth fastest growing retail sales behind the UK, France, and Australia, while the rest of the countries with faster growth are all emerging markets. Meanwhile, 5 of the countries in our Dashboard have actually seen contractions in their most recent y/y retail sales reading. (Bespoke)

Observations from Bespoke data:
-
If the 3 countries with the fastest growth rates in retail sales are the U.K., France and Australia, either the U.S. data is wrong or the world has a serious problem with personal consumption.
-
Median and average growth rates are now lower than in 2012. Let’s hope that the U.S. data is wrong.
Fed Hints a Bias Toward Hiking Endures as Balance-Sheet Rolloff Nears End
(…) “Several” policy makers indicated “if the economy evolved as they expected, they would view it as appropriate to raise the target range for the federal funds rate later this year.”
That was balanced by another group of “several” officials who “argued that rate increases might prove necessary only if inflation outcomes were higher than in their baseline outlook.”
That left some economists convinced the minutes weren’t quite as dovish as the message seemingly delivered on Jan. 30, when the Fed dropped a longstanding reference in its statement to “further gradual increases” in rates, and replaced it with a promise to be patient in deciding the “timing and size of future adjustments.” (…)
The Global Trade Slowdown Will Get Worse Before It Gets Better
(…) The discrepancy between Chinese and Japanese trade data is one bad sign for global economy optimists. Chinese statisticians recorded a 2% month-over-month fall in imports from Japan in January, while Japan recorded a 31.7% fall in exports to China over the same period. That’s the biggest divergence between the two data sets in eight years.
The bad news is that such big data gaps are typically resolved to more closely match Tokyo’s numbers. (…)
Korean trade figures released Thursday, which cover the first 20 days of February, also suggest that the contraction in global trade is continuing, not reversing. Exports and imports fell by 11.7% and 17.3% respectively year over year, the worst figures for each since mid-2016. Exports to China fell by 13.6%.
Korea’s weakness today means global weakness tomorrow thanks to its position at the center of many international supply chains. Machinery components exported from Korea to other Asian countries often become finished products that are exported to Europe or the U.S. weeks or months later. (…)
Trump Continues to Weigh EU Auto Tariffs President says possible levies depend on trade talks; ‘We’re trying to make a deal’
(…) “We’re trying to make a deal, they’re very tough to make a deal with,” Mr. Trump said, sitting alongside Austrian Chancellor Sebastian Kurz, who was in Washington for bilateral meetings with the Trump administration. “If we don’t make a deal, we’ll do the tariffs.” (…)
There has been virtually no backing from the domestic auto industry for tariffs, although the United Auto Workers has voiced cautious support. (…)
VW boss warns US car tariffs could cost billions
Diess agrees with estimates of annual €2.5bn earnings hit in ‘worst-case situation’
Trade deal ‘coming soon’, Huawei’s Meng to be ‘released in weeks’
Tensions between China and the United States will ease in the next few months as the two sides reach consensus on a series of trade issues, while Huawei executive Meng Wanzhou could be released as early as April, according to a senior adviser to the Communist Party. (…)
Xie said that while China was willing to make concessions on trade – because of its huge trade surplus – it would be less flexible on structural changes.
“That is China’s bottom line,” he said. “The US will get some benefits in trade terms, but it will have to concede on the issue of economic structure.”
He said it was also important for China to “gain buffer time” for its economic growth. (…)
China Offers to Buy $30 Billion More U.S. Agricultural Imports a Year
China is proposing that it could buy an additional $30 billion a year of U.S. agricultural products including soybeans, corn and wheat as part of a possible trade deal being negotiated by the two countries, according to people with knowledge of the plan.
The offer to buy the extra farm produce would be part of the memoranda of understanding under discussion by U.S. and Chinese negotiators in Washington, according to the people, who asked not to be identified because the plans are confidential. The purchases would be on top of pre-trade war levels and continue for the period covered by the memoranda, they said. (…)
In 2017, China imported a total $24.2 billion in American agricultural products, with 60 percent of that in oilseeds and the remaining in products such as meat, cotton, cereals and seafood. Combined purchases slumped by a third to about $16 billion last year as China’s 25 retaliatory tariffs on American farm goods reduced imports.
Russia Exploits U.S.-China Trade Tensions to Sell More Soybeans The U.S.-China trade conflict has nearly wiped out American soy exports to the bean’s biggest market, China, giving Russian farmers a chance to extend their already soaring exports to their neighbor.
(…) Russia’s overall trade with China, its biggest individual trading partner, rose more than 27% to over $100 billion last year, according to Chinese trade data. The trade has mostly involved oil, gas and metals. But Russian agricultural exports also are growing, especially soybeans, which have risen more than 10-fold in four years to nearly 1 million tons.
The trade growth is underpinned by the personal efforts of Chinese President Xi Jinping and Russian President Vladimir Putin, who have cultivated a partnership meant to challenge Washington diplomatically and economically. (…)
“There’s a niche being freed up in China [by the U.S. tariffs] and we can grow into it,” said Oleg Turkov, the agricultural minister of the Amur region. “We can sell all we can grow—the demand is unlimited.” (…)
Russia’s soy exports only make up about 1% of China’s 90-million-ton annual soy import market, according to Chinese government data. The U.S. was the second biggest exporter of soybeans to China in 2017 after Brazil, but that withered in 2018 after China retaliated against U.S. trade tariffs with duties of its own. (…)
Mr. Turkov says the Amur region will double its annual soy output to 2 million tons in the coming years, as agribusiness investors attracted by Chinese demand replace rudimentary Soviet practices and machinery with high-tech equipment. (…)
But what Russian soy growers lack in efficiency, they make up in lower transport costs. Amur region’s capital Blagoveshchensk is a ten-minute bus ride to central Heihe, a Chinese metropolis of two million people.
Amur officials and farmers hope soy leads the way to a wider agricultural export boom. In January, China had scrapped the import ban on Russian dairy and poultry. Next, the first bridge between Russia and China will open over the Amur River, followed by the first train bridge later in 2020, which local officials say will supercharge trade.
“This is just the beginning,” said Mr. Silokhin, who is now working to export his wheat to China. “There’s a lot more we can do with China.”