The enemy of knowledge is not ignorance, it’s the illusion of knowledge (Stephen Hawking)

It ain’t what you don’t know that gets you into trouble. It’s what you know for sure that just ain’t so (Mark Twain)

Invest with smart knowledge and objective odds

THE DAILY EDGE: 13 NOVEMBER 2018

Small-Business Confidence Stays at Near-Record High The National Federation of Independent Business said its optimism index remains strong at 107.4 in October. Although down slightly, that was still close to the index’s 1983 high.

On Tuesday, the NFIB said its small-business optimism index remains strong at 107.4 in October, albeit down slightly for the second consecutive month following August’s record reading of 108.8. The August reading broke the previous record of 108 set in July 1983. (…)

imageimage

image

image

image

Hmmm…Enjoy the good times.

Apartment Developers Are Slowing Construction. That Could Mean Higher Rents. Rising construction costs and a tight labor market are slowing a nearly decadelong apartment boom, likely easing a burgeoning glut at the top end of the market that has been forming across the U.S.
OIL

In a monthly report, the Organization of the Petroleum Exporting Countries said world oil demand next year would rise by 1.29 million barrels per day, 70,000 bpd less than predicted last month and the fourth consecutive reduction in its forecast.

“Although the oil market has reached a balance now, the forecasts for 2019 for non-OPEC supply growth indicate higher volumes outpacing the expansion in world oil demand, leading to widening excess supply in the market,” OPEC said in the report.

“The recent downward revision to the global economic growth forecast and associated uncertainties confirm the emerging pressure on oil demand observed in recent months.”

In the report, OPEC said its oil output rose further in October by 127,000 bpd to 32.90 million bpd after the June deal.

OPEC said the world would need 31.54 million bpd from its 15 members in 2019, down 250,000 bpd from last month. This suggests there will be a 1.36 million bpd surplus in the market should OPEC keep pumping the same amount and other things remain equal. (…)

Non-OPEC supply will rise in 2019 by 2.23 million bpd, the Vienna-based organization said, 120,000 bpd more than previously thought and far more than the increase in world demand.

Oil and gas giants such as Royal Dutch Shell (RDSa.AS), Chevron (CVX.N) and BP (BP.L) are generating as much cash at today’s oil prices of around $70 a barrel as they did in 2014, before crude spiraled down from over $100 a barrel to lows of below $30 a barrel.

As they emerge from the deepest downturn in decades, boards have vowed to remain thrifty and stick to lower spending targets in order to return value to shareholders after years of pain. (…)

The richest areas will have been exploited by the mid-2020s, meaning the average well drilled in 2025 will be less productive than today, the agency said in its annual World Energy Outlook. The U.S. will still be pumping large quantities of crude from shale rock — also known as tight oil — but output will taper off because a larger number of wells are needed to be completed to maintain or increase production. (…)

SENTIMENT WATCH

From MarketWatch

According to Goldman, its indicator at 73% marks the highest bear-market reading since the late 1960s and early 1970s, which (with a few exceptions) is consistent with returns of zero over the following 12 months. Any reading above 60% signals that subsequent returns will be lower (see chart below):

(…) For one, the bank’s Bull & Bear indicator, which tracks investor sentiment is hanging around 3.1, meaning no “contrarian buy signal” is being flagged, he says. The gauge runs from 0 to 10, with the high end representing extreme bullishness and the low end extreme bearishness. (…)

Managers surveyed believe the peak of this bull run is not here yet, with 12% upside seen from current levels, taking the S&P 500 to 3,056 (weighed average). That said, one of three respondents said they think the market has already peaked. (…)

Cash levels also dropped in November to 4.7% from 5.1%, meaning investors bought into that October correction, upping exposure to U.S. and emerging-markets stocks, REITs and health care, which is now the No. 1 overweight, in the survey.

And in a surprise to few, allocation to global techs fell out of bed, with just a net 18% of managers saying they’re overweight the sector. (…)

Ned Davis Research has its own Crowd Sentiment Indicators, courtesy of Steve Blumenthal:

  • NDR Crowd Sentiment Poll: Neutral Pessimism (S/T Bullish for Equities)Current weekly sentiment reading is 57.4.  It was 53 last week.
  • Best buying opportunities occur at “Extreme Pessimism” readings below 57.
  • Gain/Annum for the S&P 500 Index (data from December 1, 1995 to present).
  • Current indicator score highlighted in yellow:

Source: Ned Davis Research
NDR Disclosure; CMG Disclosure.

  • NDR Daily Trading Sentiment CompositeExtreme Pessimism (S/T Bullish for Equities).  Current reading highlighted below.
  • Current daily sentiment reading is 31.11.  It was 25.56 last week.
  • Best buying opportunities occur at “Extreme Pessimism” readings below 41.5.
  • 1994 to Present and 2006 to Present below (current indicator score shaded below):

Source: Ned Davis Research
NDR Disclosure; CMG Disclosure.

TECH WRECK

The NDX is down 10.7% from its Oct. 1 peak of 7700 and its 200dma has flattened:

NDX

The equal-weight NDX is down 8.6% from its peak and its 200dma is declining:

NDXE

Why would anybody be surprised? You can’t buy growth only from price increases.

The global smartphone market over time:

Source: ANZ Research (via The Daily Shot)

U.S. Adopts New Battle Plan for China’s Theft of Trade Secrets The Trump administration is broadening its China trade battle beyond tariffs with a plan to use export controls, indictments and other tools to counter the theft of intellectual property.

(…) The officials hope that the unprecedented actions taken to defend Micron—the largest American memory-chip maker—will encourage more U.S. companies to work with the government to counter intellectual property theft. (…)

The Commerce Department announced on Oct. 29 that it would effectively bar exports and transfers of U.S.-origin technology to Fujian Jinhua Integrated Circuit Co. The startup, backed by $5.7 billion in state funding, is one of China’s best hopes to build a world-class semiconductor industry. Because Jinhua depends on U.S. technology to produce its own chips, the restrictions could kill its business.

The announcement was unique in the way that it defined Jinhua as a national-security threat: U.S. officials said the Chinese company’s alleged theft of Micron’s IP could threaten the U.S. military supplier’s ability to stay in business. (…) China wants Jinhua to become its own homegrown producer of DRAM, but the nascent firm still relies on tools from U.S. suppliers to make its chips. (…)

PIKy Times in China
Unit of China’s HNA Offers Investors Airline Vouchers in Lieu of Cash

Last week we learned that holders of 271 million yuan ($39 million) of Agro-Pastoral Group Co. debt agreed to take ham or pork gift packages instead of interest payments, according to a filing on the Shenzhen Stock Exchange on Thursday reported by Grant’s which added its own suggestion that Payment in Kind be replaced by “Payment-In-Swine”

Fewer International Students Head to the U.S. American colleges and universities face growing challenge amid rising competition from other countries, concerns about safety and immigration policies

The number of new international students enrolling at American institutions fell by 6.6% during the 2017-18 academic year, on top of a 3.3% decline the year before, according to a report by the Institute of International Education released Tuesday.

Meanwhile, the total number of international students in the U.S. plus those working here on a student visa rose by just 1.5% this year. That was down from average annual growth of 6.1% over the past decade, a period during which enrollment of international students doubled.

Foreign students are big business: They pumped $42 billion into U.S. college and university coffers in the 2017-18 school year alone. (…)

The slowdown comes as U.S. schools struggle with demographic and revenue challenges due to the falling number of Americans graduating from high school. As a result, U.S. colleges and universities have become increasingly dependent on revenue generated from international students. Public schools often charge international students more than what domestic students pay. (…)

China remained the largest single source of international students, accounting for about a third of all students who come to the U.S. for postsecondary degrees. The number of students coming from Canada and Mexico, meanwhile, fell by 4.3% and 8.1%, respectively. (…)

Carol Spradling, director of the school of computer science at Northwest Missouri State University, said international enrollment began declining precipitously two years ago, following a “perfect storm” that included President Trump’s election with his tough talk on immigration and the shooting of an Indian immigrant worker in Olathe, Kan. The downturn, she said, had a huge impact on her school’s finances. (…)

Bolton Warns China Against Limiting Free Passage in South China Sea
North Korea Keeping Up Work on Missile Sites, Report Says

THE DAILY EDGE: 12 NOVEMBER 2018: Remarkable Profits

U.S. Producer Prices Surged in October Growth was driven by gains in prices for services, which grew 0.7%

The producer-price index, a measure of the prices businesses receive for their goods and services, rose a seasonally adjusted 0.6% in October from a month earlier, the Labor Department said Friday. This was the biggest monthly increase since September 2012.

When excluding the often-volatile food and energy categories, prices were up 0.5% in October from the prior month. Excluding food, energy and a volatile gauge of margins called trade services, prices grew 0.2%% last month. (…)

From a year earlier, the overall producer-price index increased 2.9% in October, while prices excluding food and energy grew 2.6% and prices excluding food, energy and trade services rose 2.8%. (…)

image

Haver Analytics’ table shows that core PPI is rising at a 2.5-3.0% annualized rate but mainly because of core services as core Goods PPI has slowed considerably since summer:

image

Oil Jumps as OPEC Moves Closer to Cutting Output Oil prices climbed out of the red after weeks of losses that had wiped out all of crude’s gains for 2018, as OPEC and its allies signaled a willingness to again cut production amid surging global supply.

(…) “We need to do whatever it takes to balance the oil market,” Saudi Arabian Energy Minister Khalid al-Falih said Monday at the start of an international gathering here of petroleum ministers and industry leaders.

Mr. Falih, the de facto head of the Organization of the Petroleum Exporting Countries, said if current supply and demand levels don’t shift, the oil-cartel and its partner producers, led by Russia, would need to cut production by around 1 million barrels a day at the group level.

Those comments came less than a day after Saudi Arabia, OPEC’s biggest member and the world’s largest exporter of crude, Russia and other producers met here in the United Arab Emirates capital to debate a potential output cut.

While the group didn’t make a final decision on output levels Sunday, they acknowledged a need to again shift strategy just months after a decision to ramp up production. (…)

“There is a consensus that there will be oversupply in 2019,” Omani Oil Minister Mohammed bin Hamad al-Rumhy told The Wall Street Journal after exiting the meeting Sunday. He said the coalition of producers would likely agree to cut back on supplies when they gather next month in Vienna. (…)

Saudi Arabia’s Mr. Falih on Sunday also said his country would unilaterally slash its exports next month by around 500,000 barrels a day, compared with November levels. However, Russia—currently the world’s largest oil producer—sent mixed messages on whether it would pull back on supply. (…)

Fed Holds Rates Steady, Signals More Rate Increases Ahead Central bank offers a mostly upbeat assessment of economy

(…) In September, Fed officials penciled in plans to raise their benchmark short-term rate once more this year. Officials are equally split over whether to raise rates two, three or four times next year. That would push the rate closer to 3%, which is where most officials expect it to settle over the long term—a so-called neutral level that neither spurs nor slows growth.

Fed Chairman Jerome Powell last month played down the debate over whether the Fed would raise rates above neutral, suggesting it was premature because rates are still boosting growth. Rates are “a long way from neutral at this point, probably,” he said. “We need interest rates to be gradually, very gradually, moving back toward normal.” (…)

Meanwhile

China’s Central Bank Ready to Tackle ‘Profound’ Economic Changes

(…) “External conditions are undergoing profound changes, downward pressures are increasing, some companies are seeing more difficulties in their operations, risks accumulated over the long term are being exposed,” the People’s Bank of China said in its quarterly monetary-policy report published late Friday. The bank will “preemptively adjust and fine-tune policies according to the changing conditions.” (…)

While sticking to what it calls “prudent and neutral” policy, the PBOC omitted a previous phrase in its policy outlook that had said it was “firmly against flood-like strong stimulus” (…)

Two weeks ago:

(…) “The leadership is paying great attention to the problems, and will be more preemptive and take action in a timely manner,” according to the statement Wednesday. The Politburo reiterated that China will maintain a proactive fiscal policy and a prudent monetary policy, while trying to find solutions to help private businesses. (…)

(…) “Internationally, advanced technology and key technology is more and more difficult to obtain. Unilateralism and trade protectionism have risen, forcing us to travel the road of self-reliance,” Mr Xi told workers in September during a tour of China First Heavy Industries in north-east Heilongjiang province, known as the heart of China’s rust belt. (…)

EARNINGS WATCH

The Q3 earnings season is almost over. Seventy-seven percent of the 451 companies that have reported so far beat expectations with a record beat rate of +6.5%. Only 2 sectors did not beat by more than 4.1%. The revenue beat is +1.4% to an expected 8.5% growth rate, up from 7.4% forecast on Oct.1.

A truly remarkable earnings season with earnings now expected up 27.8% (21.6% on Oct. 1) per Refinitiv IBES. The tax reform contributes 7-10% and buybacks add 1.9% in Q3 per Refinitiv, leaving 16-19% growth in comparable operating earnings on a 8.5% revenue growth. This in the 10th year of an economic expansion. Truly remarkable.

Trailing EPS are now $157.62 or about $160.15 pro forma the tax reform for the full 12 months.

Full year EPS are likely to exceed the current $162.65 estimate which assumes 17.8% growth in Q4 earnings when tax reform will add 7%+ and buybacks 2.0%. This would leave only 9% growth in operating earnings. The odds favor another good beat to bring 2018 growth rate around 25%.

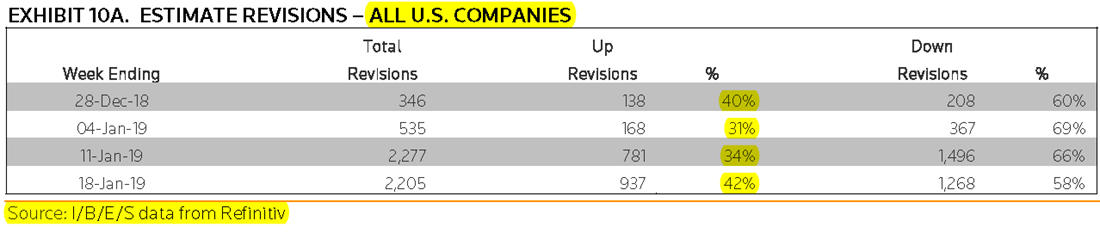
Corporate pre-announcements improved last week and are now more in line with the recent history, suggesting no major deterioration half way into the final quarter. Analysts remain upbeat, particularly on large companies:

imageimage

Since the market low at 2639 on October 29, trailing EPS have advanced 1.0% while inflation has retreated some. The Rule of 20 P/E, which peaked at a very overvalued level of 23.5 in January, is now a moderately undervalued 19.2 on pro forma trailing and 18.9 on the full year 2018 achievable estimate.

Tariffs on Chinese imports are a major, unquantifiable, risk factor as we approach the Nov. 20 meeting between Xi and Trump. On the basis of the NAFTA negotiations and the Eurozone “truce accord”, the odds are tilted in favor of a deal which would be acceptable to China and allow the Trump administration to save face with some wins. Markets would be relieved. But Trump is a loose cannon and the White House hardliners are busy lobbying. On tariffs, the odds are positive but the consequences of losing the bet can be significant since the future under 25% tariffs on a large swat of imported Chinese goods is unpredictable and scary.

Pressures from labor costs are real and a rising risk increasingly mentioned in conference calls and in corporate surveys. So far, there has been no really scary acceleration in wages but the Atlanta Fed Wage Tracker is close to 4.0%, a level that proved negative on margins in the last 2 cycles as wages (costs) rose much faster than inflation (revenues) (red rectangles = CPI range).

image

image

Thanks to the fiscal stimulus and tax cuts, business sales have recently strongly accelerated while inflation remained contained, preserving margins even though wages firmed up.

image

But the Fed wants to normalize interest rates and prevent a wage/inflation cycle. Inflation seems to provide some relief here but for how long given the strength in demand, supply bottlenecks and looming tariffs. The Fed is clearly telegraphing its intentions, warning both employers and employees to moderate their stance on wages even though conditions (labor shortage and strong profits) naturally favor rising wages. But when Amazon boosts its minimum wage to $15.00 (starting Nov. 1), it lifts the tide for everybody throughout the economy. The Fed will scrutinize whether these higher costs get easily passed on. Watch inflation!

image

Analysts are now shooting for revenue growth of 6.5% in Q4, 5.2% ex-Energy, slowing to the low 5s during 2019 (mid-4s ex-E). Absent any new stimulus, a likely scenario given the split Congress, overall demand could wane while labor and other costs rise. If investors angst about margins today when revenues are growing 8.5%, just imagine their fears if and when top line growth slows to 4.5%.

Especially with

MESSY TARIFFS

The tariff balls thrown out by the Trump administration are beginning to bounce everywhere causing a lot of unforeseen damage. The huge and complex auto industry feels all of these bounces:

Earlier this year, Pierburg US LLC, a manufacturer of parts (…) sued one of its suppliers over tariffs imposed this year by the Trump administration. The two sides have been in business for at least 20 years.

Pierburg alleged that the supplier’s refusal to ship electric motors from China to Pierburg’s factory in South Carolina unless it paid the 25% tariff cost in full was “extortion.” A failure to deliver the parts could shut down multiple auto factories and “plunge the automotive industry into complete chaos,” Pierburg said in court filings.

The supplier dismissed Pierburg’s claims as “hyperbolic rhetoric,” arguing in filings that it was under no contractual obligation to ship parts at the pre-tariff price, because of the “unexpected nature and monumental effect of the current trade war.” (…)

Over the summer, some auto makers pre-emptively sent out letters through their legal departments, warning suppliers that the tariffs shouldn’t be a pretext for renegotiating price agreements, say executives and attorneys who were contacted. Some companies are now asking tariff-relief provisions be inserted into new supply agreements going forward, a request nearly unheard of before this summer, say attorneys.

(…) the new tariffs will cost Toyota $100 million this fiscal year and likely even more in the following year. “We’re not going to have a blanket statement to say we agree to absorb 100% of the costs,” Mr. Young said in an interview. “It’s not an open checkbook.”

The average operating profit margin in the auto parts manufacturing business is already slim–about 7%, according to the Original Equipment Suppliers Association—so extra costs can hit earnings hard. Car companies, facing cooling U.S. demand for cars and trucks after a multiyear growth streak, are also reluctant to pass costs on to car buyers by raising prices.

Ford Motor Co. CEO Jim Hackett said in September that tariff-related costs would shave about $1 billion from the company’s bottom line this year. General Motors Co. also dialed back its full-year profit guidance in July, citing rising commodity costs related to new steel and aluminum tariffs.

Some smaller parts suppliers have resorted to pleading with customers for help.

This summer, (…) Clips & Clamps Industries, a small Detroit-area parts maker with about 57 employees, sent one-page letters to about 15 customers proposing a cost-sharing arrangement for future contracts. Clips & Clamps was on pace to turn a profit this year, but rising materials costs have wiped out its margin.

Two customers agreed. A few politely declined. One buyer from Canada wrote back, expressing sympathy. “They basically said: ‘I’m sorry your government is doing this to you, but what do you expect me to do about it?’” Mr. Aznavorian said. (…)

Peterson American Corp., North America’s largest privately owned maker of springs used in car engines, was recently told by one of its steel vendors that the company would withhold shipment of the wire coils it delivers to its factories unless the manufacturer agreed to pay the tariff costs. (…)

“We’ve had a couple other suppliers threaten to hold trucks,” he said. “It’s happening all over the industry.”

Barron’s: Bank of America Merrill Lynch strategist James Barty:

“We continue to believe that the outcome of US/China trade talks is crucial to global markets,” Barty contends. “Failure would accentuate the deterioration in global growth and fully justify investors’ fears.” (…)

Third-quarter earnings saw an uptick in the number of companies blaming tariffs for lackluster guidance, and we can expect more to do so the longer the trade war trundles on. (…)

TECHNICALS WATCH

The S&P is bouncing against its declining 200dma:

spy

As is its equal-weighted index:

rsp

Pointing up The 13/34–Week EMA Trend Chart is worrisome:

Still positive: Ned Davis Research has its own demand/supply indicator: it looks at a smoothed total volume of declining issues versus a smoothed total volume of advancing issues using a broad market equity index.


Lowry’s Research sees the “re-appearance of strong Demand and the likelihood for new highs for the bull market in the weeks and months ahead.” Its Buying Power Index climbed back to the dominant position above the Selling Pressure Index, “also demonstrating a resurgence in Demand”.

This is true for large caps which “have clearly been the primary beneficiaries of Demand during the rebound rally (…). By contrast, “continued weakness among small caps during a further market rally would be consistent with an aging bull market.”

“Since 1950, US stock markets have never been down six months and a full year following midterm elections.”

Stock Market Bulls Re-Emerge After Bruising Selloff Money managers are doubling down on stocks after a brutal October selloff, as cheaper valuations and the potential for continued profit gains help support a rebound among equities.

UBS Group AG said Thursday it was increasing its exposure to stocks, including in the U.S. and emerging markets, while asset-management giant BlackRock Inc., BMO Global Asset Management and QMA, the $128 billion quant-equity arm of PGIM, Prudential Financial ’sinvestment-management business, all recently reiterated their preference for stocks. (…)

“Even if we use our own relatively cautious estimates on earnings for 2019, which include the expected impact of tariffs in the U.S. and Asia and a modest slowdown in headline economic growth, valuations still look favorable,” [UBS] added.

The broad index is currently trading at 16 times forward earnings, down from 17 times at the end of the September, according to FactSet. Meanwhile, the risk premium among U.S. shares stands at 4.6%, above the long-term average of 3.2%, UBS added. (…)

In emerging markets, equities are now trading at 11 times future earnings, a discount to the 30-year average of 13 times, according to UBS. European stocks are trading at 12 times future earnings, versus a long-term average of 16 times. (…)

Devil Arrrgh!

  • Emerging markets at “a discount to the 30-year average of 13 times, according to UBS”. It truly kills me to read stuff like that and think some trusting folks will invest on wrong, twisted facts. Here are the real facts: 
    • Since 2000, that’s almost 20 years, the P/E on the MSCI Emerging Markets has ranged between 8.0 and 13.0. So much for the 30-year average of 13.
    • Any idea how the complexion of “emerging markets” has changed in the last 30 years and how that might have affected the “average” P/E ratio? Just in the last 10 years, China has moved from 14% of the MSCI EM Index to its current 31%. A bunch of “Others” are next in line at 27% from 39% in 2008 while Brazil went from 14% to 6% and Russia from 10% to 3%. So if you still want to trade on the basis of an EM 30-year average P/E ratio, or on such an average for that matter, you should not read Edge and Odds. Barely knowing what you buy and unable to know what you will eventually sell, you’ll never get any edge, and the odds will always be very much against you. Buy lottery tickets instead.
  • Europe MSCI Index P/E last reached 16 times very, very briefly in early 2015. Prior to that, you have to go back to the 2002 bear market to meet a P/E of 16 on collapsed earnings. Since 2003, the EMU MSCI P/E has fluctuated between 7.5 and 15.0 times forward earnings. These are known, post factum earnings. The P/E on future, unknown earnings, is now 11.9. FYI, local currency EMU EPS are barely above their last peak of 2011 and remain 15% below their 2007 peak level. Not exactly what analysts have been saying for several years. Same with revenues. Why should we care about this totally dis-functional artificial creation, however beautiful Europe is?

(…) it’s fair to say that much of Europe, including France, remains afloat financially only because of implicit backing from the European Central Bank (…). So here’s the problem: If Italy is authorized to spend whatever it wants, other governments might feel a political need to do the same. Eurozone countries then could end up in a race to use up the ECB’s credibility for fear others will use it up first. (Holman W. Jenkins, Jr. in the WSJ)

Geographical diversification? Only if you really want to dilute potential gains with a hodge-podge of equity markets that have nothing to do with each other, are terribly difficult to understand, are awfully volatile and unpredictable and/or invest in companies operating in questionable legal frameworks. As Don Coxe used to say, Emerging/Submerging markets. And that includes Europe’s Club Med countries.

Markets in the USA, Canada, the U.K., Germany, and Japan provide plenty of opportunities without all the uncertainties (known and unknown unknowns) coming with other markets. Nothing wrong to play India or China for a small percent of one’s investable assets but leave me alone with Europe, EMU and EM benchmark non-sense.

 A Non-Recession Bear Market Has Likely Begun

Steve Blumenthal:

If evidence emerges that the U.S. economy is slowing, a non-recession, cyclical bear market would be the most likely outcome. That’s my base case.

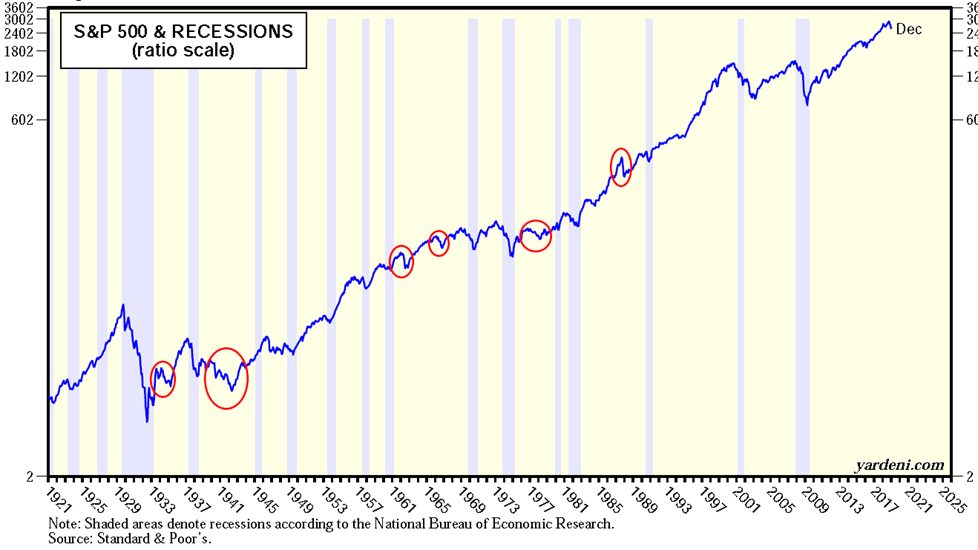
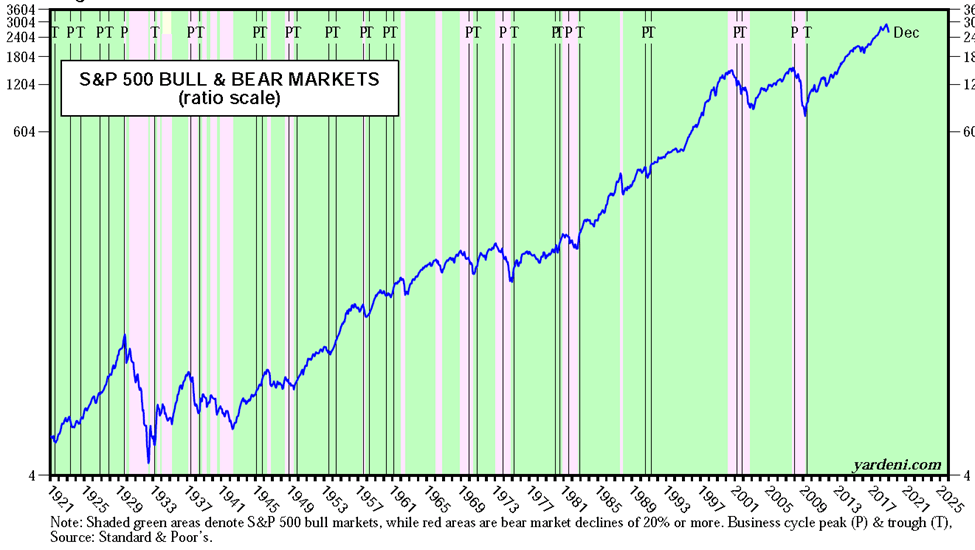
Since 1946, non-recession bears have had a median decline of around 23% lasting about six months.  With recession, the median decline is 37% lasting an average of 17 months.

NDR did a study looking at data back to 1946. They found there have been 16 corrections of at least 10% within what they define as cyclical bull markets. There are secular (or long-term) bull and bear market cycles (we are currently in a long-term secular bull) and shorter-term cyclical bull and bear market cycles. Of the 16 minus 10% cases, eight were followed by breadth thrusts. Breadth thrusts are defined as a high percentage of stocks moving up together – an indicator of market strength. Healthy markets see the majority of stocks accelerating vs. just a few carrying the market higher as was the case in 1999 and perhaps Facebook, Amazon, Apple, Netflix and Google in the current cycle. Recall that in September, just 10 stocks accounted for more than 100% of the 9% gain in the S&P 500 Index. A great example of the lack of broad-based stock participation or non-breadth thrust.

  • In the eight cases where there was positive broad participation, the cyclical bull lasted another 22 months and the S&P 500 Index gained an additional 56.3% (median percent change) before reaching a peak.
  • In the eight non-breadth thrust cases, the cyclical bull lasted another six months and the S&P 500 Index gained an additional 21.3% (median percent change) before reaching a peak.
  • Bottom line: The S&P 500 gained 13.6% over seven months from the February 8 low to the September 20 high. Looking at the non-breadth thrust data (1946 to present), odds favor the short-term cyclical bull market top is in. Absent recession, downside risk is 23%. Lighten up or hedge that equity exposure on rallies and buy the 20% dip.

The S&P 500 tested its February low and held. It is currently sitting just above its 200-day moving average line. A 20% correction from the September 20, 2018 high of 2,931 is roughly -600 points. Vegas odds favor a better buying opportunity below 2,400. We’ll see.

Needed for a non-recession bear: rapidly rising inflation and/or a profit recession. Neither is obvious at this time. Tariffs are the big threat at this point.

Surprised smile Volkswagen capable of building 50 million electric vehicles: CEO in Automobilwoche  Volkswagen’s electric vehicle platform and battery procurement plans are being readied to handle production of 50 million vehicles, Chief Executive Herbert Diess told German trade publication Automobilwoche.

The electric vehicle platform has been “booked” for 50 million cars, Diess said, adding that battery procurement has also been readied to handle this amount.

“We have bought batteries for 50 million vehicles,” Diess was quoted by Automobilwoche on Monday.

Volkswagen Group sold 10.7 million vehicles in 2017.

A Fifth of China’s Homes Are Empty. That’s 50 Million Apartments

(…) Soon-to-be-published research will show roughly 22 percent of China’s urban housing stock is unoccupied, according to Professor Gan Li, who runs the main nationwide study. That adds up to more than 50 million empty homes, he said.

The nightmare scenario for policy makers is that owners of unoccupied dwellings rush to sell if cracks start appearing in the property market, causing prices to spiral. (…)

Holiday homes and the empty dwellings of migrants seeking work elsewhere account for some of the deserted properties, but purchases for investment are a key factor keeping the vacancy rate high, according to Gan. (…)