The enemy of knowledge is not ignorance, it’s the illusion of knowledge (Stephen Hawking)

It ain’t what you don’t know that gets you into trouble. It’s what you know for sure that just ain’t so (Mark Twain)

Invest with smart knowledge and objective odds

THE DAILY EDGE: 25 JANUARY 2019: Small Cap Margins Slipping

RECESSION WATCH
U.S. Leading Economic Indicators Decrease

The Conference Board’s Composite Index of Leading Economic Indicators declined 0.1% (+2.1% year-on-year) during December following an unrevised 0.2% gain in November. The series is comprised of 10 components which tend to precede changes in the overall economy. As a result of the government shutdown two of the components of the index — new orders for consumer goods and materials as well as building permits — are not available for December, thus the Conference Board forecast these series. Moreover, a third component, nondefense capital goods orders is based on preliminary November data. Given this, there is a high likelihood of a revision to the December reading of the Index of Leading Indicators. The Conference Board also postponed the regularly scheduled benchmark revisions of the composite indicators until all underlying data are available.

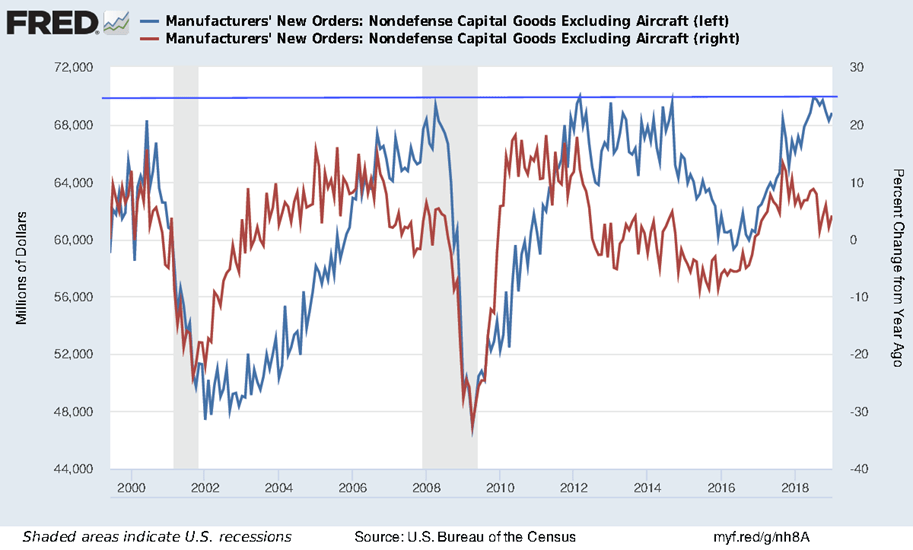
The drop in equities prices in December was the biggest contributor to the negative reading. Weakness in the ISM new orders index as well as building permits also drove the index lower. Lower claims, looser credit conditions, improved consumer expectations for business/economic conditions, a steeper yield curve and some strength in both measures of manufacturing orders made positive contributions. Three-month growth in the leading index fell at a 0.7% annual rate, the largest decline in almost three years.

The Index of Coincident Economic Indicators increased 0.2% (4.3% y/y) in December following an unrevised 0.2% gain during November. All of the index components — changes in personal income less transfer payments, industrial production, nonagricultural payroll employment and manufacturing & trade sales — made positive contributions. Three-month growth in the coincident index increased at a 2.3% annual pace, in line with recent trends.

The Index of Lagging Economic Indicators increased 0.5% last month (2.8% y/y) following upwardly revised 0.5% growth in November. Strength in commercial & industrial loans outstanding and the six-month growth in the services CPI drove the majority of the gain. The average duration of unemployment was the only negative contributor. The three-month growth in the lagging index jumped at 6.2% annual rate, the fastest pace in six years.

large image

Smoothed LEI

(Advisor Perspectives)

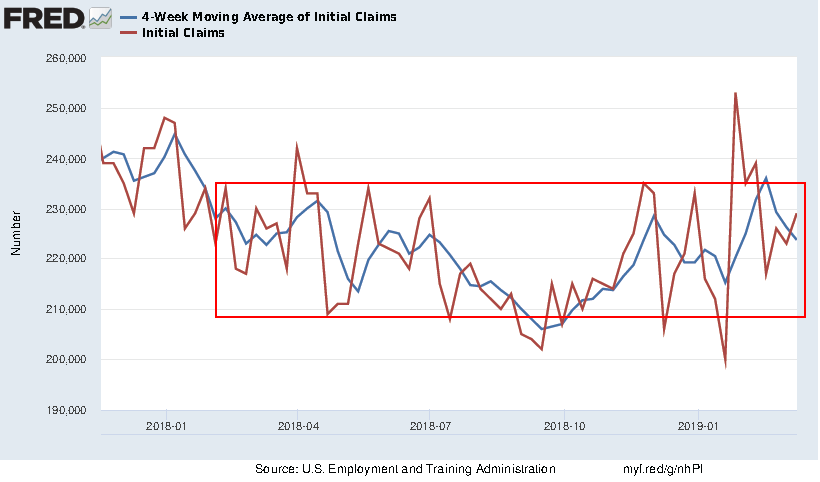
Labor Market Powers On Despite Growth Concerns Initial jobless claims, a proxy for layoffs across the U.S., fell last week to the lowest level since 1969

Initial jobless claims declined by 13,000 to a seasonally adjusted 199,000 in the week ended Jan. 19, the Labor Department said Thursday. This marks the lowest level for claims since November 1969, when applications clocked in at 197,000. (…)

image

Global trade cycle downturn intensifies

Another worrying development in the survey came from export data, which showed international demand for Japanese goods falling at the steepest pace since July 2016. Historically, the New Export Orders PMI has picked up the various gyrations in Japan’s export cycle. Latest official data for Japan indicated that exports declined 3.8% year-on-year in December, the fastest drop in two years, with flash data signalling a further reduction in January. Anecdotal evidence from the latest survey suggested that producers of semiconductor-related items in Japan had particularly suffered in January.

Indeed, preliminary trade data released on Monday for the first 20 days of January from South Korea, a world leader in semiconductor exports, revealed that exports of the electronic component contracted 28.8% when compared to the same period in 2018. Meanwhile, total exports were down 14.6% compared to last year in the first 20 days of January.

South Korea’s exports, often regarded as a bellwether for the health of the global economy, have faced an increasingly less hospitable backdrop in recent months, according to our PMI Export Climate Index, matching the slowing trend seen in semiconductor trade. Given the pro-cyclical nature of the semiconductor industry, falling sales is a negative signal for the global economy. (Markit)

China to step up economic stimulus in slowdown fight  China will take steps to spur growth amid a trade war with the United States, but there is limited room for aggressive stimulus in an economy already laden with massive debts and a property market prone to credit-driven spikes, policy insiders said.

(…) “The room for a strong stimulus is not big, and there are very big risks, because that will rely on a flood of cash and increased leverage in the economy,” said a policy insider, declining to be named due to the sensitivity of the matter. (…) Sources have told Reuters that Beijing was planning to lower its growth target to 6-6.5 percent this year from around 6.5 percent in 2018. (…)

President Xi Jinping said this week that China must be on guard against “black swan” risks, meaning unforeseen events that have extreme consequences, while fending off so-called “grey rhino” events – obvious threats that go ignored. (…)

In December, top leaders pledged to step up “counter-cyclical” support for the economy, and said fiscal policy would be “more forceful and effective” and monetary policy would be prudent with “appropriate tightness and looseness”.

Details on the fiscal stimulus are expected to be unveiled during the annual parliamentary meeting in March.

Mario Draghi Sounds Economic Alarm for the Euro-Area

(…) After holding off in December from fully downgrading his assessment, the ECB president finally caved on Thursday by saying the risks to growth “have moved to the downside.” That’s a significant change from six weeks ago, when he described the risks as “broadly balanced” and capped monetary support. (…)

  • Draghi said that the “persistence of uncertainties in particular relating to geopolitical factors and the threat of protectionism is weighing on economic sentiment.” (…)
  • Draghi said policy makers were also united in the view that the likelihood of a euro-zone recession as being low, while acknowledging that a serious downturn in one part of the bloc could spread. (…)
Fed Weighs Earlier End to Bond Portfolio Runoff Federal Reserve officials are close to deciding they will maintain a larger portfolio of Treasury securities, putting an end to the central bank’s portfolio wind-down closer into sight.

Officials are still resolving details of their strategy and how to communicate it to the public, according to their recent public comments and interviews. With interest rate increases on hold for now, planning for the bond portfolio could take center stage at a two-day policy meeting of the central bank’s Federal Open Market Committee next week. (…)

The Fed’s decision about the size of its portfolio is being driven by a technical debate inside the central bank about reserves in the banking system, not over whether officials want to provide more or less stimulus to the economy.

Reserves are the funds banks keep on deposit with the Fed. When the Fed expanded its portfolio of bondholdings during and after the financial crisis, it expanded the amount of reserves in the financial system, pumping banks with money as it bought bonds. The banks in turn kept the new money on deposit with the central bank. (…)

The Fed has never said what size portfolio it wants, but a survey of financial institutions by the New York Fed provides some clues about where it could end up. The survey in December said market participants thought reserves would stabilize at $1 trillion in a year’s time. That compares to $1.7 trillion last week and $2.8 trillion in 2014. At that rate, the Fed’s asset portfolio would shrink to $3.5 trillion, larger than previous estimates of $1.5 trillion to $3 trillion. It is around $4 trillion now. (…)

EARNINGS WATCH

Refinitiv updates us on small cap earnings as of Jan. 22 when 45 companies had reported. The beat rate is a low 60%, only 48% in Financials which accounted for 21 of the 48 companies. The surprise factor is –1.7% (-3.8% in Financials).

The blended growth rate for Q4 is 1.9% (0.7% ex-Energy) on a 5.7% gain in revenues (5.4% ex-E). Smaller companies’ margins are slipping seriously.

Analysts are now expected the S&P 600 earnings to decline 3.8% YoY in Q1’19 (-2.9% ex-E) on a 5.3% revenue gain (5.2% ex-E).

Mid-cap companies are also experiencing margins compressions. The 31 S&P 400 companies having reported are expected to grow earnings 4.3% (3.9% ex-E) in Q4 on a 5.1% gain in revenues (4.2% ex-E). S&P 400 earnings are seen up 3.7% in Q1’19.

Major Mobile Carrier Halts Huawei Purchases Amid Security Concerns The world’s biggest mobile carrier outside China said it is temporarily halting purchases of some components made by Huawei, posing a threat to the Chinese company’s growth and delivering another blow to its reputation.

Vodafone Group VOD -4.87% PLC said Friday that it would pause the purchase of Huawei gear for use in the core of new 5G networks it’s rolling out across Europe because of uncertainty over whether some governments in the region will ban the Chinese company. (…) Vodafone is speaking with European government officials about the potential impact of Huawei bans, which could result in increased costs and delayed 5G launches. (…)

A Huawei spokesman said core equipment represents a small proportion of its communications infrastructure business and that it would continue to work with Vodafone. (…)

Trump Ally Roger Stone Charged in Mueller Probe Roger Stone, a longtime political adviser to President Trump, was arrested in Florida on charges of lying to Congress, in the latest indictment from special counsel Robert Mueller’s investigation.

THE DAILY EDGE: 24 JANUARY 2019: Strong USA in Weak World

MARKIT’S FLASH PMIs
U.S. private sector firms report solid start to 2019, helped by faster manufacturing output growth

January’s survey data indicated a solid start to the year for U.S. private sector companies, with output growth maintained at a broadly similar pace to that seen through the final quarter of 2018.

Manufacturing remained a bright spot as production volumes expanded at the fastest pace for eight months. Service providers signalled a sustained upturn in business activity during January, but the rate of growth eased to a four-month low.

At 54.5 in January, up fractionally from 54.4 in December, the seasonally adjusted IHS Markit Flash U.S. Composite PMI Output Index was well above the 50.0 no-change value. The latest reading was close to the average seen over the final quarter of 2018 (54.7) and signalled robust expansion of private sector output at the beginning of 2019.

image

Higher levels of business activity were supported by a rebound in new orders growth from the 14-month low seen in December. Survey respondents mostly commented on improving underlying economic conditions and resilient confidence among clients. There were only sporadic reports citing the government shutdown as a factor weighing on demand at the start of 2019.

Stronger new business growth contributed to a marginal increase in backlogs of work at private sector firms in January. However, the rate of staff hiring eased to its weakest since May 2017. Some survey respondents attributed softer employment growth to efforts aimed at improving productivity and streamlining costs.

Input price inflation eased to a 22-month low in January, helped by weaker cost pressures across the service economy. In contrast, manufacturers continued to report sharply rising raw material costs, linked to trade tariffs and stretched domestic supply chains. Average selling prices for goods and services meanwhile rose at a slightly increased rate, although the rate of inflation was the second- weakest seen over the past year.

Looking ahead, business optimism lifted up from December’s one-year low, rising especially sharply in the manufacturing sector, though remained below last year’s average.

The seasonally adjusted IHS Markit Flash U.S. Services PMIâ„¢ Business Activity Index slipped to 54.2 in January from 54.4 in December, but still signalled a solid upturn in service sector output. New business growth remained subdued in comparison to the peaks seen in the first half of 2018. The latest rise in new work was one of the weakest seen in the past year-and-a-half.

Service providers signalled only a modest rebound in business expectations from the 12-month low seen in December. Subdued growth projections for the year ahead contributed to more cautious hiring strategies in January. The latest increase in payroll numbers was the weakest since April 2017.

The main positive development in January was a slowdown in input cost inflation to its lowest for almost two years. Prices charged by service providers also increased at a much slower pace than seen on average in the second half of 2018.

Manufacturing growth regained momentum at the start of 2019, according to the latest survey data. Adjusted for seasonal influences, the IHS Markit Flash U.S. Manufacturing Purchasing Managers’ Index™ (PMI™) rose to 54.9 from 53.8 in December. The improvement in overall business conditions was driven by the fastest expansion of production since May 2018. New orders, employment and stocks of purchases also increased at faster rates in January.

Survey respondents generally cited robust domestic demand, which more than offset a slowdown in export sales growth to its weakest for three months. Moreover, latest data indicated that manufacturers are more confident about the 12-month business outlook than at any time since May 2018.

Stretched supply chains remained a challenge for manufacturers, with vendor lead-times lengthening for the twenty-fifth month running in January. Strong demand for inputs and higher imported raw materials costs related to trade tariffs led to a strong rise in input prices and another robust increase in factory gate charges across the manufacturing sector.

Chris Williamson, Chief Business Economist at IHS Markit:

The resilience of the survey data suggest little impact from the government shutdown on the private sector, with very few companies reporting any material detrimental impact on their output or order books. Historical comparisons suggest January’s survey data are indicative of the economy growing at an annualised rate close to 2.5%. However, as the survey does not include the government sector, the impact of the shutdown may not be fully captured. (…)

The jobs data from the surveys were also somewhat disappointing, with the overall rate of job creation slipping to a 20-month low. However, even this weaker January survey employment index reading is consistent with private sector payroll growth of approximately 150,000. (…)

The apparent resilience of the U.S. economy is further supported by the following observations, although we seem to be on shaky ground:

  • The US Sales Manager Index (SMI) from World Economics shows that business activity is holding up in January. However, business confidence softened, and the pace of hiring (“staffing levels”) slowed substantially. (The Daily Shot)

(…) Major components of the barometer were mixed in January. Trends in construction-related resins, pigments and related performance chemistry were mixed, suggesting slow housing activity. Plastic resins used in packaging and in consumer and institutional applications turned positive, performance chemistry gained, and U.S. exports were mixed. Equity prices retreated sharply again this month, and product and input prices fell as well. Inventory indicators were positive.

The diffusion index was stable at 53 percent. This index marks the number of positive contributors relative to the total number of indicators monitored.

“The CAB continues to signal gains in U.S. commercial and industrial activity through mid-2019, but at a much slower pace as growth (as measured by year-earlier comparisons) has turned over,” said Kevin Swift, chief economist at ACC. “Despite three straight months of decline in the barometer, the cumulative decline is 1.0 percent – well below the 3.0 percent that would signal negative growth in the U.S. economy.”

CalculatedRisk has the chart:

Euro area business growth close to stalling at 5½ year low in January

The euro area economy edged closer to stagnation at the start of 2019, with businesses reporting the weakest rise in output for five-and-a-half years and the first fall in demand for over four years. The IHS Markit Eurozone Composite PMI® fell to 50.7 in January from 51.1 in December, its lowest since July 2013, according to the preliminary ‘flash’ reading. The latest reading indicated only marginal growth of business output, contrasting markedly with the strong rates of expansion seen this time last year.

image

Both manufacturing and services saw growth slow closer to stagnation. The factory sector reported the weakest expansion since the current production upturn began in July 2013, while the service sector expansion was the smallest since August 2013. Inflows of new work fell compared to December, registering the first such decline since November 2014 and signalling the largest drop in demand for goods and services since June 2013.

New orders for goods fell for a fourth successive month, declining at a rate not seen since April 2013, while inflows of new business in the service sector slipped into decline for the first time since July 2013.

Deteriorating exports contributed to the disappointing order book picture. Exports fell for a fourth successive month, dropping at the steepest rate since comparable data for combined manufacturing and services exports were first available just over four years ago. Services saw exports decline at an increased rate.

image

Outstanding work decreased for the second consecutive month, worsening at the sharpest pace since December 2014. Falling backlogs were commonly caused by companies having to eat into back-orders in order to support current output growth amid reduced inflows of new business.

The decline in order books was a key factor behind a reduction in the pace of overall job creation to the lowest since September 2016. Jobs growth has now cooled for five months in a row. Employment growth waned in both sectors, though services saw an especially marked slowdown.

Looking ahead, future optimism improved slightly during the month, though remained close to recent four-year lows to reflect a gloomier picture than seen throughout much of last year. Company concerns centred on the overall bleaker economic picture developing for the year ahead, often linked to international trade tensions, Brexit and rising political stress, especially in France and Italy but also globally. The weakness of the auto sector also remained a key area of concern.

Analysing trends within the region, businesses in France reported an increased rate of decline, blamed on the combination of disruptions caused by on-going ‘Gilets Jaunes’ protests and a generally weakened demand environment. Output fell in both manufacturing and services, resulting in the largest overall drop in business activity since November 2014. In Germany, output growth picked up compared to December thanks to faster growth in the service sector, but the monthly expansion was still the second-weakest seen over the past four years. The headline manufacturing PMI recorded the first deterioration in business conditions since November 2014, fuelled by the largest falls in factory orders and exports seen since December 2012.

Weakness in the auto industry was once again widely reported, as was a slowdown in demand from China.

Elsewhere, the rate of output growth sank to its lowest since November 2013, slowing to only weak rates in both manufacturing and services. New order growth was likewise the weakest since November 2013, led by the first fall in manufacturing for five-and-a-half years.

Looking at prices, average output charges meanwhile rose at a slightly increased rate, in part due to rising selling prices in Germany associated with increased road toll charges as well as some signs of upward wage pressures. However, there was better news on input cost inflation, which moderated to the lowest for nearly one-and-a-half years. Softer cost inflation principally reflected lower oil prices and easing capacity constraints in supply chains, allowing firms to negotiate lower prices in many instances. The incidence of supplier delays was the lowest for two-and-a-half years. Both input cost and selling price inflation eased in manufacturing but picked up slightly in services.

The Eurozone economy slipped closer to stall speed in January, with companies reporting the first drop in demand for over four years. The disappointing survey data indicate that GDP is rising at a quarterly rate of just 0.1%. (…) Companies are concerned about a wider economic slowdown gathering momentum, with rising political and economic uncertainty increasingly affecting risk appetite and demand.

Flirting with recession. Blackstone is not optimistic:

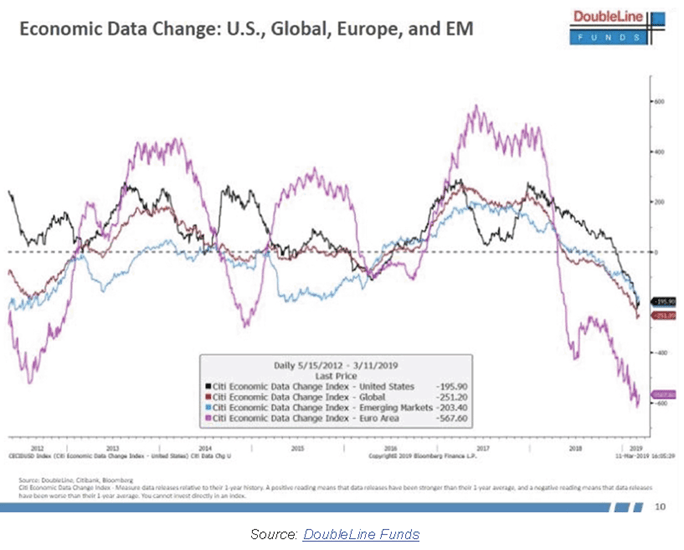
Eurozone leading economic indicators declined 2.0% year over year in November and the Citi Economic Surprise Index is negative, indicating that data releases have been worse than expected.1 Notably, since the Eurozone’s formation in 1999, every instance of a 2% YoY decline in leading indicators has been followed by a recession or QE

Eurozone Leading Economic Indicators

Nor is NBF, with caveats:

The zone’s industrial production seems to have contracted on a year-on-year basis in the final quarter of 2018. The last two times this happened (2008 and 2012), the common currency area eventually fell into recession. Does this latest blotch of red ink on industrial output mean the Eurozone is headed for yet another recession? That possibility cannot be ruled out especially if the deceleration of global trade extends into 2019, social unrest in places such as France and Italy gather momentum and/or Brexit spirals into something worse. But if those can be avoided, the zone has potential to bounce back. There were indeed extraordinary events that hurt Germany’s economic activity in the second half last year, including tougher pollution standards (which hurt auto sales) and an extended drought which affected major waterways (and hence goods transportation) including the crucial Rhine river. More importantly, financial markets are functioning well and allowing credit to flow freely in the Eurozone. As today’s Hot Chart shows, unlike in 2008 and 2012, loans to households and non-financial corporations continue to grow at a healthy clip, which bode well for consumption spending and business investment.

image

Gavekal on a broader front:

Alas, most growth indicators look weak: ISM surveys and OECD leading indicators have recently disappointed. Weak points can be seen in the struggling automobile sector, slowing Chinese economy, softening real estate prices in almost every major market and a slashing of capital spending in the energy sector. It is hard to find much, beyond the employment data (a notoriously lagging indicator), to be cheerful about on the growth front.

image
Japan manufacturing sector flatlines as demand weakens and production is reduced
  • Flash Japan Manufacturing PMI® falls to 50.0 in January (52.6 – December), ending longest expansionary run for over a decade.
  • Exports decline at strongest pace in two-and-a-half years
  • Production scaled back for first time since July 2016, while confidence lowest in over six years.

Preliminary PMI data for January bodes ill for Japan’s manufacturing sector, indicating the end of a near two-and-a-half-year growth run as the index dropped to 50.0. The underlying picture will raise concern given renewed reductions were seen in new orders and output. Further signs that the downturn in the global trade cycle could yet worsen were also signalled, with new export orders falling at the sharpest rate since July 2016. The widely-anticipated rebound in Q4 should not distract from the bigger picture. Domestic economic weakness compounded with slowing global growth coincided with the lowest level of business confidence for over six years.

image

Meanwhile in Canada (via The Daily Shot)

CERTAIN UNCERTAINTIES
Businesses reveal growing uncertainty worldwide

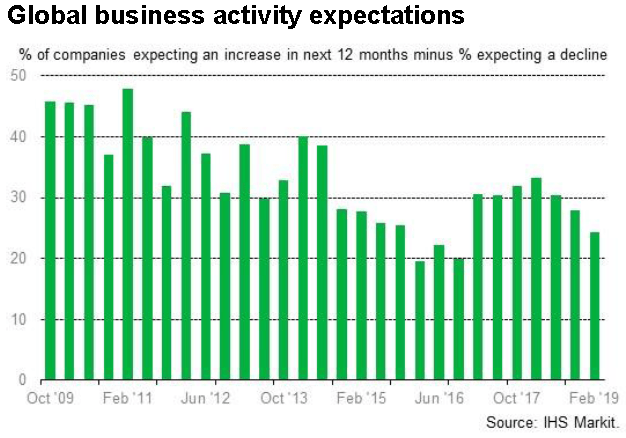
Analysis of survey anecdotal evidence suggests that global business uncertainty spiked higher at the end of 2018 to reach a 22-year survey high. Companies reported heightened political and economic risk and worries about declining exports, according to the PMI survey responses.

IHS Markit’s Purchasing Managers’ Index® (PMI®) surveys are based on monthly questionnaires of carefully selected companies across over 40 countries. Globally, the surveys compile responses from around 28,000 companies monthly. (…)

Panellists across the world have increasingly highlighted uncertainty when predicting their future output in recent months. December recorded the most mentions of the word “uncertainty” from businesses expecting future output to decrease since the series began in July 1996. Moreover, this represented a stark increase from the already high frequency seen throughout the year. (…)

image

Analysing individual comments reveal key factors influencing this uncertainty. Broadly, these consist of political tensions, economic worries and the deteriorating international trade environment.

The downturn in trade has been of notable consequence recently, with the frequency of comments rising sharply. Concurrently, the J.P.Morgan Global Manufacturing PMIâ„¢ exports index has signalled a decline in exports for four successive months, prompted by US and Chinese tariffs and slowing output growth.

Panel comments also capture the trends of rising political and economic uncertainty over the course of last year. Mentions of political tension grew to near-peak levels in December, in part due to Brexit and other worries across Europe, but also worldwide political friction.

image
EARNINGS WATCH

We now have 76 Q4 reports in and the beat rate is steady at 78% while the surprise factor, currently +2.2%, is more volatile (+1.7% the day before) but holding ok.

Revenue surprises are not quite as strong (61%) but revenue growth for the 76 companies is 6.3% vs an expected 5.8%. Financials account for 38% of reporters so far and their revenues are up only 2.7%.

Refinitiv’s blended growth rate for Q4 is now 14.2% (14.1% yesterday).

Q1’19 growth slipped from +2.7% to +2.6%.

Full year 2019 EPS are $171.04, down from $171.29 yesterday.

We see some potential for more downgrades, although the ERR is nearing past trough levels outside of recessions. U.S. earnings are coming off a “sugar high,” with 2018’s fiscal stimulus and tax cuts setting a high bar to clear. Earnings per share (EPS) of global stocks are expected to grow 6.6% in 2019, versus 14.9% in 2018, according to consensus estimates. (Blackrock)

image

SENTIMENT WATCH
Airplane Via David R. Kotok Chairman and Chief Investment Officer, Cumberland Advisors

Air Traffic Controllers, Pilots, Flight Attendants Detail Serious Safety Concerns Due to Shutdown

Washington, D.C. — On Day 33 of the government shutdown, National Air Traffic Controllers Association (NATCA) President Paul Rinaldi, Air Line Pilots Association (ALPA) President Joe DePete, and Association of Flight Attendants-CWA (AFA) President Sara Nelson released the following statement:

“We have a growing concern for the safety and security of our members, our airlines, and the traveling public due to the government shutdown. This is already the longest government shutdown in the history of the United States and there is no end in sight. In our risk averse industry, we cannot even calculate the level of risk currently at play, nor predict the point at which the entire system will break. It is unprecedented.

“Due to the shutdown, air traffic controllers, transportation security officers, safety inspectors, air marshals, federal law enforcement officers, FBI agents, and many other critical workers have been working without pay for over a month. Staffing in our air traffic control facilities is already at a 30-year low and controllers are only able to maintain the system’s efficiency and capacity by working overtime, including 10-hour days and 6-day workweeks at many of our nation’s busiest facilities. Due to the shutdown, the FAA has frozen hiring and shuttered its training academy, so there is no plan in effect to fill the FAA’s critical staffing need. Even if the FAA were hiring, it takes two to four years to become fully facility certified and achieve Certified Professional Controller (CPC) status. Almost 20% of CPCs are eligible to retire today. There are no options to keep these professionals at work without a paycheck when they can no longer afford to support their families. When they elect to retire, the National Airspace System (NAS) will be crippled.

“The situation is changing at a rapid pace. Major airports are already seeing security checkpoint closures, with many more potentially to follow. Safety inspectors and federal cyber security staff are not back on the job at pre-shutdown levels, and those not on furlough are working without pay. Last Saturday, TSA management announced that a growing number of officers cannot come to work due to the financial toll of the shutdown. In addition, we are not confident that system-wide analyses of safety reporting data, which is used to identify and implement corrective actions in order to reduce risks and prevent accidents is 100 percent operational due to reduced FAA resources.

“As union leaders, we find it unconscionable that aviation professionals are being asked to work without pay and in an air safety environment that is deteriorating by the day. To avoid disruption to our aviation system, we urge Congress and the White House to take all necessary steps to end this shutdown immediately.”